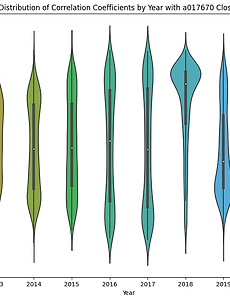
반응형 Analysis27 Correlation distribution 이 무엇인가? Correlation distribution은 특정 기준에 따라 여러 변수 간의 상관관계의 분포를 나타내는 그래프입니다. 예를 들어, 주식 시장에서는 특정 주식과 나스닥에 상장된 다른 모든 주식 간의 종가 상관계수를 계산하여 이를 분석할 수 있습니다. 이 그래프는 x축에 상관계수를, y축에 빈도수를 나타내며, 주식 간의 상관관계의 강도와 분포를 시각적으로 이해할 수 있게 해줍니다. 상관계수는 -1에서 1 사이의 값을 가지며, 1에 가까울수록 두 변수 간에 강한 양의 상관관계가, -1에 가까울수록 강한 음의 상관관계가 있음을 의미합니다. 0 근처의 값은 변수 간에 상관관계가 거의 없거나 약함을 나타냅니다. 이러한 분석은 시장의 동향을 이해하고, 위험 관리 및 포트폴리오 다각화 전략을 수립하는 데 유용할 수.. 2024. 1. 31. SK텔레콤 Distribution of Correlation Coefficients by Year with a017670 Close Prices 년간 상관계수 분포도의 변화 상관계수 분포도란 무엇인가 https://chat.openai.com/g/g-X1vYUg5J2-dataunion ChatGPT - DATAUNION Stock Analysis chat.openai.com 2024. 1. 28. 30 days Rolling Correlation violin plot import pandas as pd from sqlalchemy import create_engine import seaborn as sns import matplotlib.pyplot as plt import numpy as np # SQLAlchemy 엔진 설정 engine = create_engine("mysql+pymysql://root:1*****s@localhost/krxstock?charset=utf8") # 모든 테이블 이름 가져오기 table_query = "SHOW TABLES" tables = pd.read_sql(table_query, con=engine) table_names = tables.iloc[:, 0].tolist() # 날짜 설정 start_date = pd.Timest.. 2024. 1. 26. Portfolios recommended by chatGPT here are 10 different stock portfolios, each with a unique personality, that you may consider: Growth Portfolio: This portfolio is focused on stocks with high growth potential, typically in emerging markets or cutting-edge industries. The stocks in this portfolio are high-risk, high-reward, and may not pay dividends. Example stocks: Amazon, Tesla, Square, MercadoLibre, and Shopify. Value Portfol.. 2023. 2. 19. 이전 1 2 3 4 5 ··· 7 다음 반응형