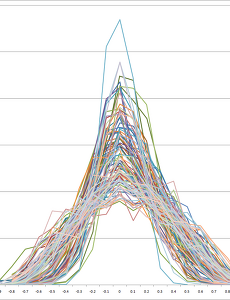
반응형 Analysis27 [python] 2021 NASDAQ CORRELATION HISTOGRAM Start Date : 2016/11/30 End Date : 2021/01/07 6,212 NASDAQ, NYSE Stocks Close Price In [1]: import pandas as pd import numpy as np import matplotlib.pyplot as plt import seaborn as sns In [2]: data=pd.read_csv('allstock_t.csv') In [3]: data.head() Out[3]: A AA AACG AACQ AACQU AAIC AAL AAMC AAME AAN ... ZTO ZTR ZTS ZUMZ ZUO ZVO ZYME ZYNE ZYXI TSLA 0 126.16 25.23 1.27 10.54 11.15 3.93 15.38 22.39 .. 2021. 1. 9. Bitcoin Correlation Histogram X axis : Stocks Price Correlation CoefficientY axis : Quantity of stocks1,000 Day Parameter2,830 NASDAQ Stocks Price X axis : Stocks Price Correlation CoefficientY axis : Quantity of stocks1,000 Day Parameter4,338 NYSE Stocks Price X axis : Stocks Price Correlation CoefficientY axis : Quantity of stocks1,000 Day Parameter3,214 LONDON Stocks Price X axis : Stocks Price Correlation CoefficientY ax.. 2017. 5. 21. Visualization and Comparison of Stock Correlation Histogram #1 X axis : Stocks Price Correlation CoefficientY axis : Number of stocksJul-20151,000 Day Parameter2,830 NASDAQ Stocks Price All stocks was analyzed Correlation Histogram Group of four had to be divided.The group is the same as in the graph below. Zero Correlation Histogram- The stock pair is concentrated in the correlation coefficient zero. Type A Correlation Histogram- The stock pair is concentr.. 2016. 11. 22. Korrelations histogramm Typ Beschreibung 1. Was ist das Korrelations histogramm? Es ist ein Diagramm, das die Beziehung zwischen dem beobachteten Bestand und allen zur Gruppe gehörenden Beständen zeigt und sie als Verteilungsdiagramm ausdrückt.Zum Beispiel ist der Graph des Korrelationshistogramms der Starbucks Corporation (NASDAQ: SBUX) unten gezeigt.Die X-Achse (-1 ~ 1) ist der Korrelationskoeffizient und die Y-Achse listet die Bestä.. 2016. 3. 2. 이전 1 2 3 4 5 6 7 다음 반응형