| 일 | 월 | 화 | 수 | 목 | 금 | 토 |
|---|---|---|---|---|---|---|
| 1 | 2 | 3 | 4 | 5 | 6 | 7 |
| 8 | 9 | 10 | 11 | 12 | 13 | 14 |
| 15 | 16 | 17 | 18 | 19 | 20 | 21 |
| 22 | 23 | 24 | 25 | 26 | 27 | 28 |
- NASDAQ
- Ltd
- correlation
- AI
- 스트라이다
- kosdaq
- distribution
- KRX
- volume
- Histogram
- Apple
- ChatGPT
- stock
- ATR
- 자전거여행
- Magic
- Inovio Pharmaceuticals
- kospi
- 069500
- GPT
- bigdata
- Forex
- Trip
- 태그를 입력해 주세요.
- correlatiom
- 미드저니
- 상관관계
- story
- KODEX200
- Today
- Total
DATAUNION
Correlation Insights: How Major NASDAQ Stocks Move Together 본문

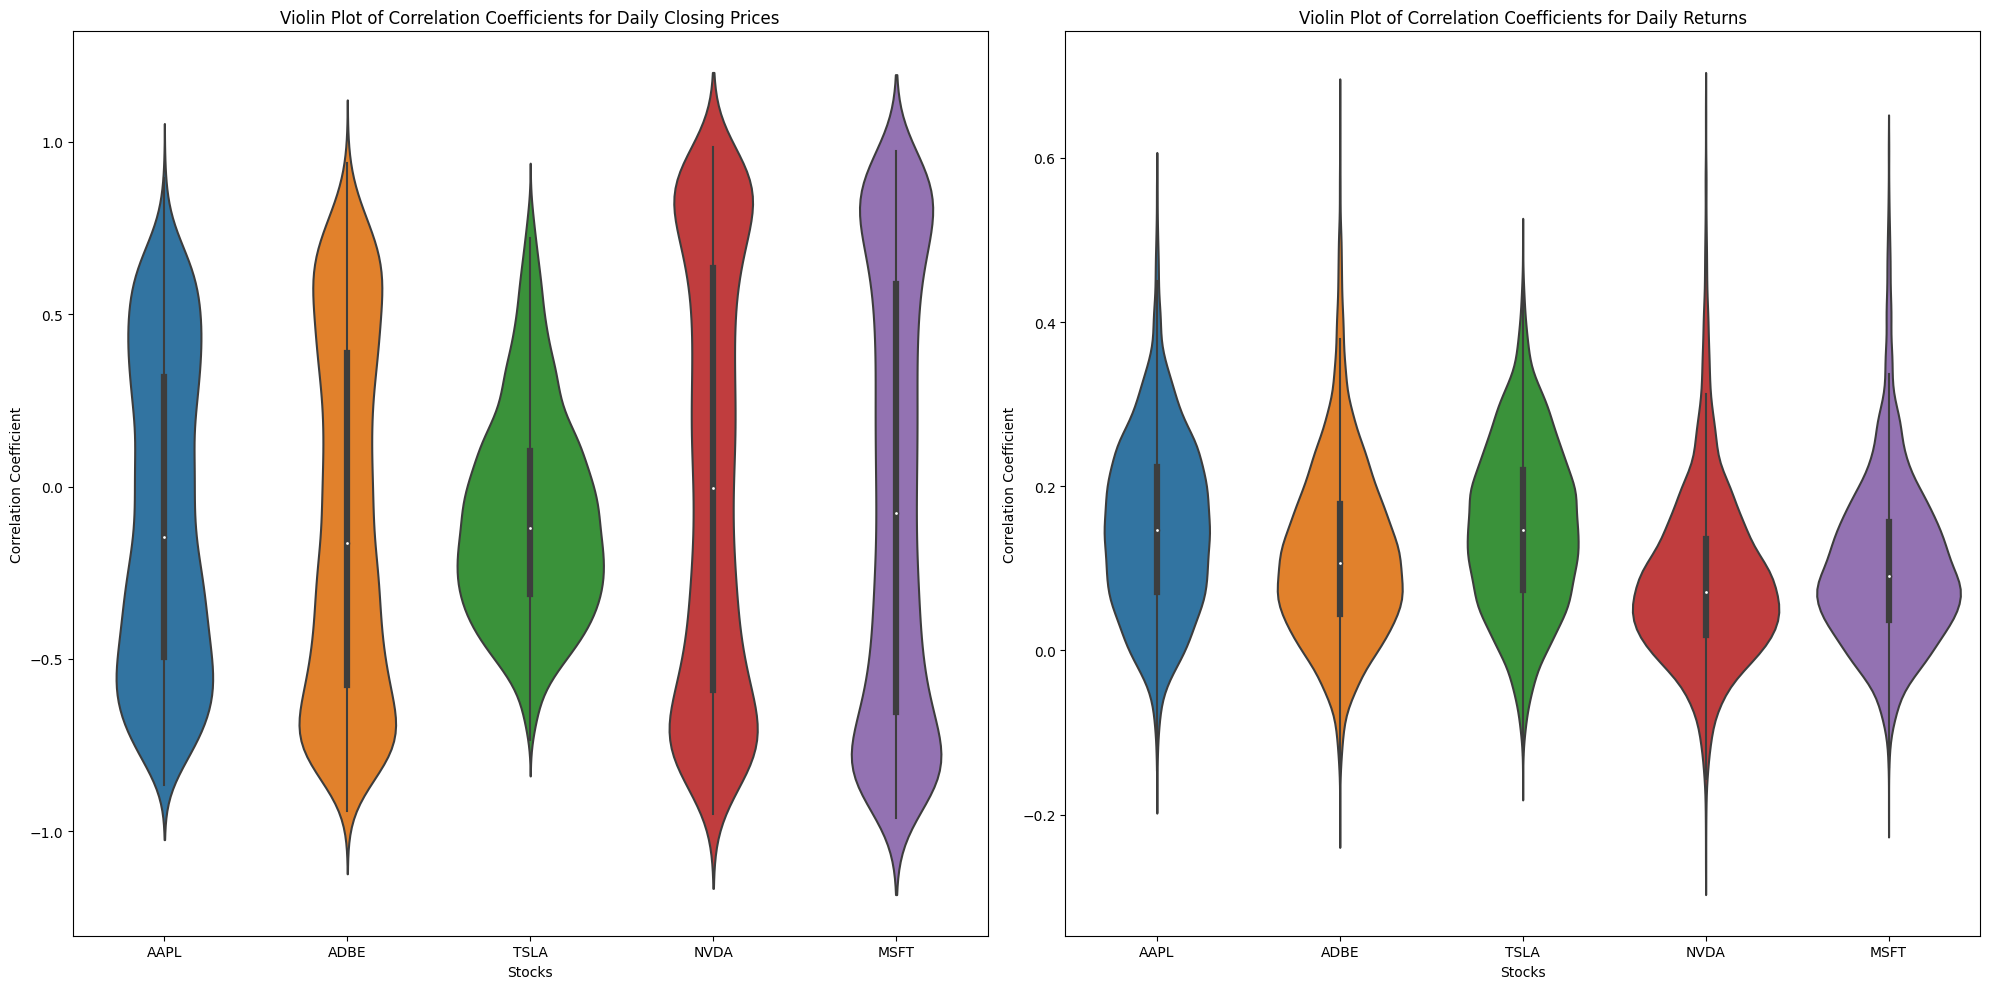
This graph contains two violin plots illustrating the distribution of correlation coefficients between specific stocks and the entire NASDAQ composite index. The plots are based on data from January 1, 2023, to June 1, 2024.
Each plot visualizes the correlation coefficients based on daily closing prices and daily returns, respectively.
### Left Graph: Distribution of Correlation Coefficients Based on Daily Closing Prices
This plot shows how the daily closing prices of each stock correlate with the daily closing prices of the entire NASDAQ composite index.
- **AAPL (Apple)**: The distribution of correlation coefficients ranges from -1 to 1, but most values are centered around 0. This indicates that Apple's stock price has a relatively low correlation with the overall NASDAQ composite index.
- **ADBE (Adobe)**: The distribution is wide, with a median close to 0, suggesting that Adobe's stock price changes have a low correlation with the NASDAQ composite index.
- **TSLA (Tesla)**: The median correlation coefficient is around 0, with a wide distribution, indicating that Tesla's stock price changes do not have a significant correlation with the NASDAQ composite index.
- **NVDA (NVIDIA)**: The distribution is wide and centered around 0, suggesting that NVIDIA's stock price changes have a low correlation with the NASDAQ composite index.
- **MSFT (Microsoft)**: The distribution ranges from -1 to 1, with a median close to 0, indicating a low correlation between Microsoft's stock price changes and the NASDAQ composite index.
### Right Graph: Distribution of Correlation Coefficients Based on Daily Returns
This plot shows how the daily returns of each stock correlate with the daily returns of the entire NASDAQ composite index.
- **AAPL (Apple)**: The distribution of correlation coefficients is centered around 0, indicating that Apple's daily returns have a low correlation with the NASDAQ composite index.
- **ADBE (Adobe)**: The distribution is centered around 0, with some values showing a positive correlation.
- **TSLA (Tesla)**: The distribution is centered around 0, indicating that Tesla's daily returns have a low correlation with the NASDAQ composite index.
- **NVDA (NVIDIA)**: The distribution is centered around 0, suggesting that NVIDIA's daily returns have a low correlation with the NASDAQ composite index.
- **MSFT (Microsoft)**: The distribution is centered around 0, indicating that Microsoft's daily returns have a low correlation with the NASDAQ composite index.
### Summary
- Each stock shows relatively low correlation with the overall NASDAQ composite index in terms of both closing prices and returns.
- AAPL, ADBE, TSLA, NVDA, and MSFT exhibit diverse correlations with the NASDAQ composite index, with most distributions centered around 0.
- This suggests that the price movements of these stocks are not strongly related to the average price movements of the entire NASDAQ composite index. Considering these correlations is important when developing investment strategies.
'Analysis' 카테고리의 다른 글
| 2025년 금 시세 전망: 글로벌 경제 환경과 투자 전략의 재조명 (0) | 2025.02.15 |
|---|---|
| GPT와 대화 : 리벨런싱 시뮬레이션 (1) | 2025.01.03 |
| The distribution of correlation coefficients for Berkshire Hathaway Class B shares ("BRK-B") (0) | 2024.02.17 |
| Show a violin plot comparing the respective correlation coefficient distributions of AAPL, ADBE, and TSLA over the last 100 days. (1) | 2024.02.05 |
| Correlation distribution 이 무엇인가? (0) | 2024.01.31 |


