| 일 | 월 | 화 | 수 | 목 | 금 | 토 |
|---|---|---|---|---|---|---|
| 1 | 2 | 3 | 4 | 5 | 6 | 7 |
| 8 | 9 | 10 | 11 | 12 | 13 | 14 |
| 15 | 16 | 17 | 18 | 19 | 20 | 21 |
| 22 | 23 | 24 | 25 | 26 | 27 | 28 |
- KODEX200
- GPT
- 자전거여행
- correlatiom
- stock
- Apple
- kospi
- bigdata
- Ltd
- Inovio Pharmaceuticals
- 상관관계
- Magic
- 태그를 입력해 주세요.
- volume
- story
- NASDAQ
- AI
- 미드저니
- ATR
- 스트라이다
- 069500
- Trip
- Histogram
- KRX
- ChatGPT
- distribution
- kosdaq
- Forex
- correlation
- Today
- Total
DATAUNION
The distribution of correlation coefficients for Berkshire Hathaway Class B shares ("BRK-B") 본문
The distribution of correlation coefficients for Berkshire Hathaway Class B shares ("BRK-B")
DATAUNION 2024. 2. 17. 23:22
I found the stock symbol for Berkshire Hathaway Class B shares listed as "BRK-B" in the dataset, along with other related symbols such as "BRK-A" for Class A shares and various others that include "BRK" in their symbols. Now, I will proceed to calculate the correlation distribution of daily closing prices between "BRK-B" and all other stocks listed in the dataset.
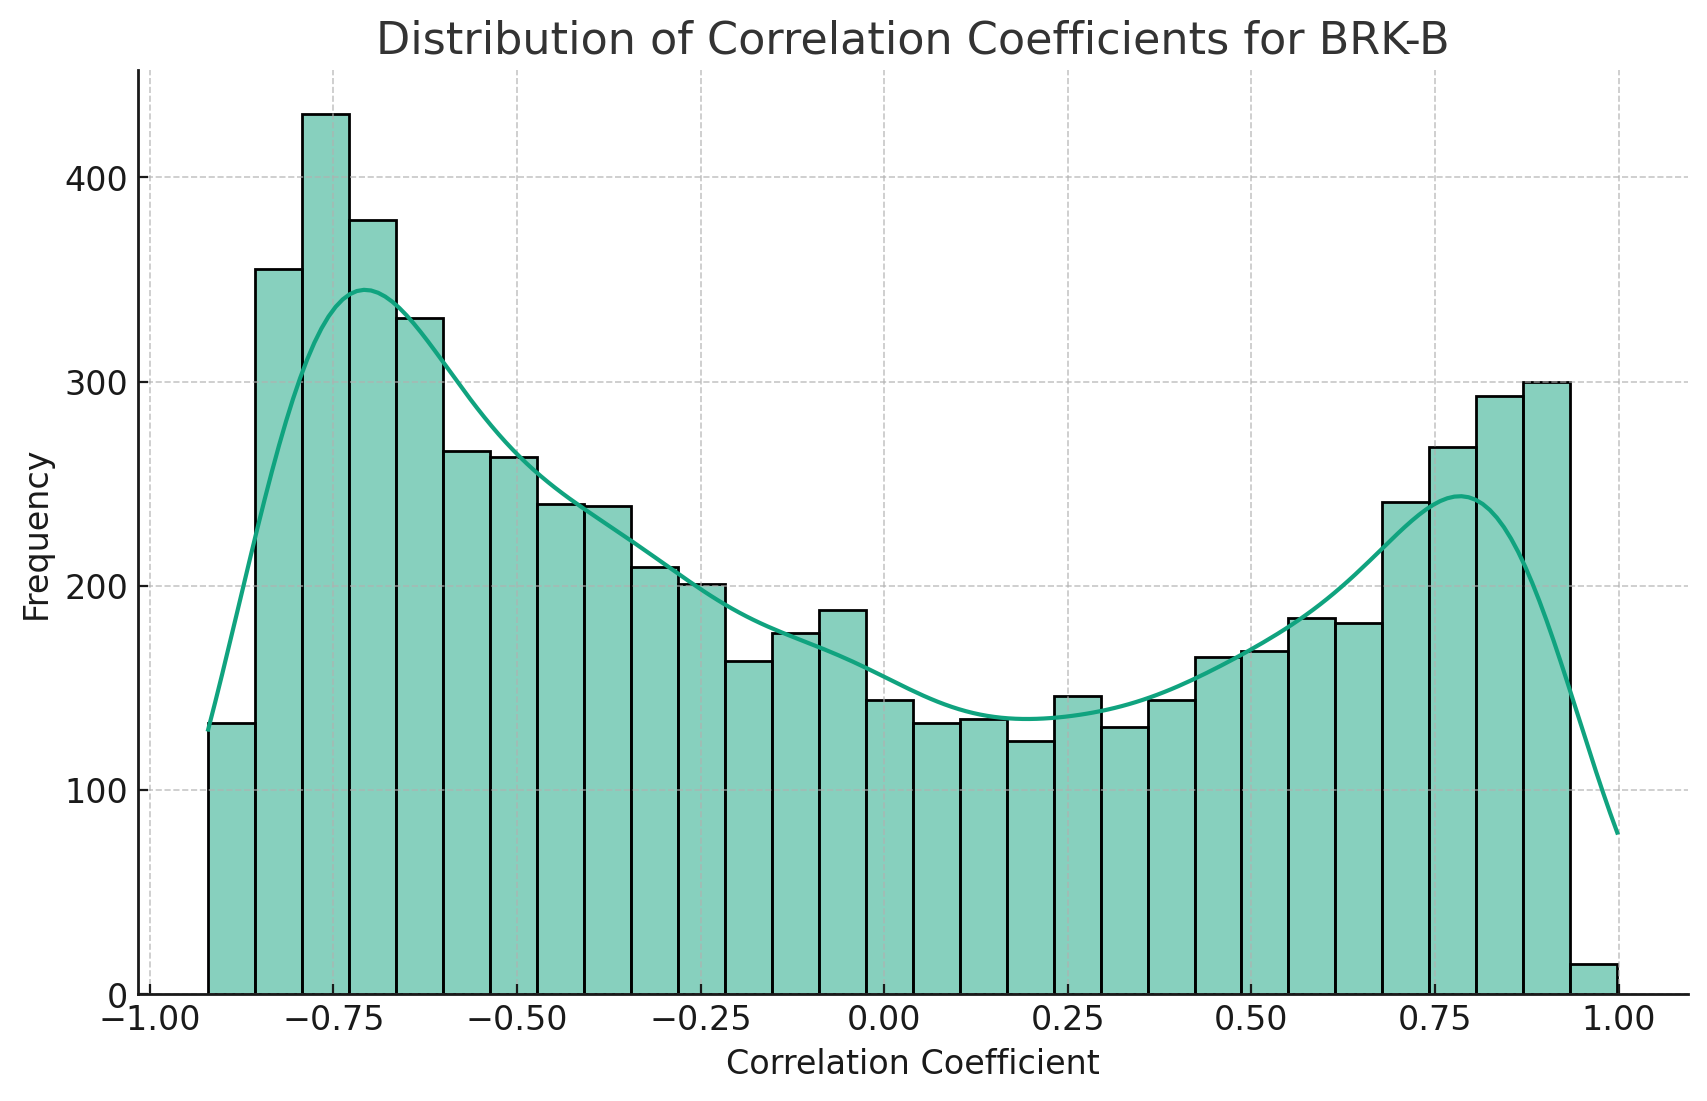
The correlation coefficients between Berkshire Hathaway Class B shares ("BRK-B") and other stocks listed have been calculated. These coefficients range from strong positive correlations (close to 1) to strong negative correlations (close to -1), indicating a variety of relationships in terms of daily closing prices.
Next, I will plot the distribution of these correlation coefficients to visualize the frequency of each correlation range and then calculate the skewness and kurtosis for further analysis.
The distribution of correlation coefficients for Berkshire Hathaway Class B shares ("BRK-B") with other stocks shows a variety of relationships. The skewness of the distribution is approximately 0.26, indicating a slight bias towards higher correlation coefficients, but overall suggests a fairly symmetrical distribution. The kurtosis is approximately -1.38, suggesting that the distribution is somewhat flatter than a normal distribution, with fewer outliers than expected in a normal bell curve.
This analysis reveals that "BRK-B" has a diverse range of correlations with other stocks, from strongly positive to strongly negative, with a slight tendency towards positive correlations. The relatively flat distribution implies a broad spread of correlation values, indicating varied relationships in terms of daily closing prices with other stocks listed.
https://chat.openai.com/g/g-szpTRdbYU-dataunion
ChatGPT - DATAUNION
For equity risk management, being able to see the distribution of correlation coefficients can be insightful.
chat.openai.com


