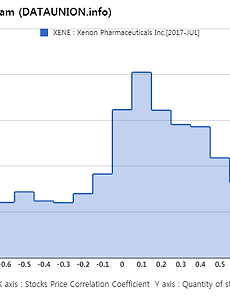
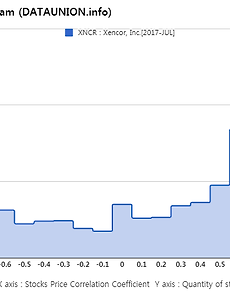
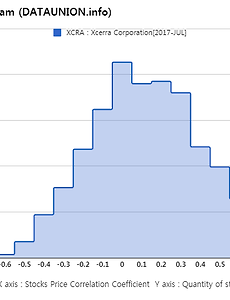
반응형 NASDAQ6630 Xenon Pharmaceuticals Inc. $XENE Correlation Histogram X axis : Stocks Price Correlation Coefficient Y axis : Quantity of stocks 1,000 Day Parameter 2,926 NASDAQ Stocks Price Correlation Histogram Type Description 1. Zero Correlation Histogram- The stock pair is concentrated in the correlation coefficient zero.- Case the diversification, Zero type will Overweight of the portfolio.- And, Zero type are often low volatility. 2. Type A Correlation Histo.. 2017. 8. 26. Xenetic Biosciences, Inc. $XBIO Correlation Histogram X axis : Stocks Price Correlation Coefficient Y axis : Quantity of stocks 1,000 Day Parameter 2,926 NASDAQ Stocks Price Correlation Histogram Type Description 1. Zero Correlation Histogram- The stock pair is concentrated in the correlation coefficient zero.- Case the diversification, Zero type will Overweight of the portfolio.- And, Zero type are often low volatility. 2. Type A Correlation Histo.. 2017. 8. 26. Xencor, Inc. $XNCR Correlation Histogram X axis : Stocks Price Correlation Coefficient Y axis : Quantity of stocks 1,000 Day Parameter 2,926 NASDAQ Stocks Price Correlation Histogram Type Description 1. Zero Correlation Histogram- The stock pair is concentrated in the correlation coefficient zero.- Case the diversification, Zero type will Overweight of the portfolio.- And, Zero type are often low volatility. 2. Type A Correlation Histo.. 2017. 8. 26. Xcerra Corporation $XCRA Correlation Histogram X axis : Stocks Price Correlation Coefficient Y axis : Quantity of stocks 1,000 Day Parameter 2,926 NASDAQ Stocks Price Correlation Histogram Type Description 1. Zero Correlation Histogram- The stock pair is concentrated in the correlation coefficient zero.- Case the diversification, Zero type will Overweight of the portfolio.- And, Zero type are often low volatility. 2. Type A Correlation Histo.. 2017. 8. 26. 이전 1 2 3 4 5 6 7 8 ··· 1658 다음 반응형