
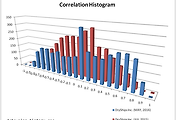
X axis : Stocks Price Correlation Coefficient |
Y axis : Quantity of stocks |
May-2016 |
1,000 Day Parameter |
2,830 NASDAQ Stocks Price |
Analysis |
This stock mode of correlation coefficient is 0.4 |
In other words, the correlation coefficient of the other stocks is the many levels 0.4 |
Kurtosis of the distribution of the correlation is -0.4, and skew is -0.44 |
Correlation Histogram Type Script |
Zero Correlation Histogram |
- The stock pair is concentrated in the correlation coefficient zero. |
- If The diversification, Zero type will Overweight of The portfolio. |
- And, Zero type are often low volatility. |
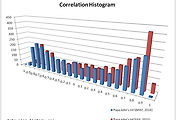
Type A Correlation Histogram |
- The stock pair is concentrated in the plus high correlation coefficient and minus high correlation coefficient. |
- A type will underweight of the portfolio. |
- This is not a normal distribution. |
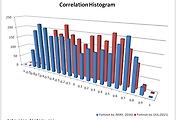
Type B Correlation Histogram |
- The stock pair is concentrated in the plus high correlation coefficient. |
- B type will underweight of the portfolio. |
- This is not a normal distribution. |
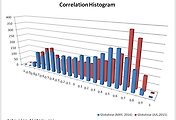
Type C Correlation Histogram |
- The stock pair is concentrated in the minus high correlation coefficient. |
- C type will underweight of the portfolio. |
- This is not a normal distribution. |
Information is provided "as is" and solely for informational purposes, not for trading purposes or advice, and may be delayed. |
Information provided by the investment decisions are not legally responsible for. In addition, the information posted can not be distributed without permission. |
'NASDAQ' 카테고리의 다른 글
| [2016-MAY] DryShips Inc. NASDAQ : DRYS Correlation Histogram (0) | 2016.05.28 |
|---|---|
| [2016-MAY] Fortinet Inc NASDAQ : FTNT Correlation Histogram (0) | 2016.05.28 |
| [2016-MAY] Globalstar NASDAQ : GSAT Correlation Histogram (0) | 2016.05.28 |
| [2016-MAY] Papa John's Int'l NASDAQ : PZZA Correlation Histogram (0) | 2016.05.28 |
| [2016-MAY] Marvell Technology Group Ltd. NASDAQ : MRVL Correlation Histogram (0) | 2016.05.28 |
댓글