반응형
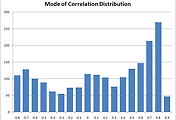
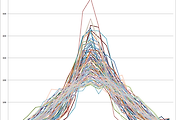
X axis : Stocks Price Correlation Coefficient
Y axis : Number of stocks
1,000 Day Parameter
Stocks Price vs KOSPI, KOSDAQ
Information is provided "as is" and solely for informational purposes, not for trading purposes or advice, and may be delayed.
Information provided by the investment decisions are not legally responsible for. In addition, the information posted can not be distributed without permission.
반응형
'Analysis' 카테고리의 다른 글
| 2015's NASDAQ index is B type Correlation Histogram (0) | 2016.01.09 |
|---|---|
| 2015 NASDAQ Correlation Histogram (0) | 2015.12.18 |
| The greatest number : B type (0) | 2014.06.04 |
| Zero Group Correlation Distribution (0) | 2014.06.01 |
| [May-2014] Volume vs TR(True Range) Correlation Distribution (0) | 2014.05.31 |
댓글