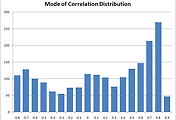
TR(True Range) = High Price of intraday - Low Price of intraday
X axis : TR vs Volume Correlation Coefficient
Y axis : Number of stocks
May-2014
500 Day Parameter
KOSPI, KOSDAQ
Analysis
This data mode of correlation coefficient is 0.7.
Kurtosis of the distribution of the correlation is -0.66, and skew is -0.64.
The data are to be concentrated in the correlation coefficient 0.7 and The high correlation holds many stocks.
March 2014 to May 2014 there is no change in the special relationship.
Reference : ATR
| 종목05 | correl_05 |
| KODEX 200 | 0.1028 |
| 동화약품 | 0.57362 |
| S&T모터스 | 0.91961 |
| 경방 | 0.58098 |
| 메리츠화재 | 0.55532 |
| 삼양홀딩스 | 0.52517 |
| 삼양홀딩스우 | 0.52933 |
| 하이트진로 | 0.52482 |
| 하이트진로2우B | 0.35119 |
| 유한양행 | 0.54383 |
| 유한양행우 | 0.06191 |
| CJ대한통운 | 0.17468 |
| 하이트진로홀딩스 | 0.74634 |
| 하이트진로홀딩스우 | 0.4396 |
| 두산 | 0.49343 |
| 두산우 | 0.43259 |
| 두산2우B | 0.29503 |
| 성창기업지주 | 0.6924 |
| 대림산업 | 0.65999 |
| 대림산업우 | 0.68266 |
| 유유제약 | 0.75361 |
| 유유제약1우 | 0.7393 |
| 유유제약2우B | 0.73694 |
| 일동제약 | 0.7089 |
| 한국타이어월드와이드 | 0.68012 |
| 삼천당제약 | 0.73858 |
| 기아차 | 0.65096 |
| 대유신소재 | 0.73767 |
| 노루홀딩스 | 0.49852 |
| 노루홀딩스우 | 0.54862 |
| 노루홀딩스2우B | 0.58423 |
| 삼환기업 | 0.81127 |
| 삼환기업우 | 0.67676 |
| 한화손해보험 | 0.3977 |
| 삼화페인트 | 0.80001 |
| 롯데손해보험 | 0.47158 |
| 로케트전기 | 0.76509 |
| 로케트전우 | 0.77106 |
| 대원강업 | 0.29524 |
| 중앙에너비스 | 0.68405 |
| 조선내화 | 0.19612 |
| 대동공업 | 0.48716 |
| 가온전선 | 0.59177 |
| 삼일제약 | 0.51949 |
| 흥국화재 | 0.08891 |
| 흥국화재우 | 0.48947 |
| 흥국화재2우B | 0.35316 |
| CS홀딩스 | 0.81273 |
| 동아쏘시오홀딩스 | 0.53055 |
| 천일고속 | 0.68507 |
| SK하이닉스 | 0.50815 |
| 영풍 | 0.08357 |
| LS네트웍스 | 0.35912 |
| LS네트웍스우 | 0.79906 |
| 한진해운홀딩스 | 0.45719 |
| 현대건설 | 0.65514 |
| 현대건설우 | 0.86544 |
| 이화산업 | 0.72183 |
| 경남기업 | 0.69589 |
| 삼성화재 | 0.35991 |
| 삼성화재우 | 0.41254 |
| 삼성물산 | 0.68695 |
| 삼성물산우 | 0.74132 |
| 화천기공 | 0.66381 |
| 건설화학 | 0.75289 |
| 한화 | 0.64947 |
| 한화우 | 0.60311 |
| 보해양조 | 0.58473 |
| 보해양조우 | 0.76997 |
| 유니온 | 0.64371 |
| 전방 | 0.12711 |
| 한국주철관 | 0.79654 |
| 동부하이텍 | 0.78042 |
| 동부하이텍1우 | 0.84475 |
| 동부하이텍2우B | 0.8012 |
| 신라섬유 | 0.5855 |
| 페이퍼코리아 | 0.76768 |
| CJ | 0.75052 |
| CJ우 | 0.679 |
| JW중외제약 | 0.8203 |
| JW중외제약우 | 0.50916 |
| JW중외제약2우B | 0.49886 |
| 대한방직 | 0.38012 |
| 만호제강 | 0.5258 |
| LG상사 | 0.62407 |
| 대한제분 | 0.4784 |
| 국보 | 0.71696 |
| 유진투자증권 | 0.38727 |
| 금호전기 | 0.77286 |
| 동국제강 | 0.26638 |
| GS글로벌 | 0.78081 |
| 남광토건 | 0.22911 |
| 부국증권 | 0.11929 |
| 부국증권우 | 0.09528 |
| 제일모직 | 0.73406 |
| 백광산업 | 0.65859 |
| 삼성제약 | 0.65756 |
| SG충남방적 | 0.62316 |
| KG케미칼 | 0.62454 |
| 태원물산 | 0.72001 |
| 세아베스틸 | 0.66126 |
| 대한전선 | 0.47465 |
| 현대해상 | 0.5228 |
| BYC | 0.45624 |
| BYC우 | 0.35802 |
| 삼부토건 | 0.76527 |
| HMC투자증권 | 0.61198 |
| SK증권 | 0.75083 |
| SK증권우 | 0.43517 |
| 동양 | 0.40937 |
| 동양우 | 0.44656 |
| 동양2우B | 0.24866 |
| 동양3우B | 0.46215 |
| 동일방직 | 0.59365 |
| 안국약품 | 0.65615 |
| 조비 | 0.68688 |
| 제일연마 | 0.32667 |
| 금양 | 0.61629 |
| 동국실업 | 0.73952 |
| 종근당 | 0.79598 |
| 대상 | 0.72691 |
| 대상우 | 0.69229 |
| 대상3우B | 0.14647 |
| 신영증권 | 0.09688 |
| 신영증권우 | 0.18302 |
| SK네트웍스 | 0.35471 |
| SK네트웍스우 | 0.83342 |
| 한양증권 | 0.2852 |
| 한양증권우 | 0.09694 |
| 신화실업 | 0.66277 |
| 동양강철 | 0.67048 |
| 대한제당 | 0.54327 |
| 대한제당우 | 0.50408 |
| 대한제당3우B | 0.57888 |
| 오리온 | 0.34306 |
| 무림SP | 0.67049 |
| 삼화콘덴서 | 0.78107 |
| 이화공영 | 0.83422 |
| 삼호 | 0.60258 |
| KISCO홀딩스 | 0.20363 |
| 한국유리 | 0.07561 |
| 한국유리우 | 0.09563 |
| 코오롱 | 0.54283 |
| 코오롱우 | 0.41917 |
| 남영비비안 | 0.4834 |
| 경농 | 0.60898 |
| 고려산업 | 0.61165 |
| 도화엔지니어링 | 0.42808 |
| 삼양통상 | 0.53725 |
| 수출포장 | 0.70754 |
| 동성제약 | 0.7084 |
| 한일철강 | 0.78677 |
| 피에스텍 | 0.7841 |
| 고려제강 | 0.40178 |
| 근화제약 | 0.86062 |
| 롯데푸드 | 0.73035 |
| 삼일기업공사 | 0.54535 |
| 한국제지 | 0.2536 |
| 아세아제지 | 0.61984 |
| 한진 | 0.72377 |
| 넥센타이어 | 0.70535 |
| 넥센타이어1우B | 0.59317 |
| SH에너지화학 | 0.83975 |
| SH에너지화학우 | 0.833 |
| KCC | 0.43169 |
| 한독 | 0.80555 |
| 세기상사 | 0.47466 |
| 삼익악기 | 0.80801 |
| 화성산업 | 0.67522 |
| 벽산건설 | 0.19084 |
| 벽산건설우 | 0.84315 |
| LIG손해보험 | 0.60038 |
| 조흥 | 0.39977 |
| 제일약품 | 0.50437 |
| 오리엔트바이오 | 0.69881 |
| 신일산업 | 0.83751 |
| TCC동양 | 0.32047 |
| 국제약품 | 0.76849 |
| 보락 | 0.61414 |
| 진흥기업 | 0.84844 |
| 진흥기업우B | 0.803 |
| 진흥기업2우B | 0.69369 |
| 아모레G | 0.34076 |
| 아모레G우 | 0.37686 |
| 삼영무역 | 0.54878 |
| 선창산업 | 0.78645 |
| 미원상사 | 0.28173 |
| 신풍제지 | 0.26229 |
| 대유에이텍 | 0.56433 |
| 동양물산 | 0.80288 |
| 유성기업 | 0.71786 |
| 한국쉘석유 | 0.64611 |
| 금호산업 | 0.57594 |
| 금호산업우 | 0.79894 |
| 부광약품 | 0.80754 |
| 혜인 | 0.74272 |
| 세아제강 | 0.45984 |
| 슈넬생명과학 | 0.59894 |
| 코오롱글로벌 | 0.34619 |
| 코오롱글로벌우 | 0.14835 |
| 성보화학 | 0.3619 |
| 대웅 | 0.46099 |
| 선광 | 0.77568 |
| 일성신약 | 0.11176 |
| 디아이 | 0.74093 |
| 일신방직 | 0.32152 |
| 대원제약 | 0.69573 |
| 삼양식품 | 0.81666 |
| 태광산업 | 0.3913 |
| 흥아해운 | 0.76968 |
| 한일시멘트 | 0.68288 |
| 대주산업 | 0.7311 |
| 한국화장품제조 | 0.76433 |
| 쌍용양회 | 0.65289 |
| 쌍용양회우 | 0.78575 |
| 쌍용양회2우B | 0.8176 |
| 쌍용양회3우B | 0.58932 |
| 현대증권 | 0.68904 |
| 현대증권2우B | 0.05386 |
| 유화증권 | 0.1321 |
| 유화증권우 | 0.16679 |
| 동양증권 | 0.64262 |
| 동양증권1우 | 0.47472 |
| 한진중공업홀딩스 | 0.63631 |
| 대한항공 | 0.68925 |
| 대한항공우 | 0.64236 |
| 영진약품 | 0.75755 |
| 한화투자증권 | 0.58399 |
| 한화투자증권우 | 0.33833 |
| 대신증권 | 0.69303 |
| 대신증권우 | 0.48449 |
| 대신증권2우B | 0.4052 |
| LG | 0.57237 |
| LG우 | 0.67842 |
| IHQ | 0.61516 |
| S&T중공업 | 0.63479 |
| 동원 | 0.50639 |
| SK | 0.60575 |
| SK우 | 0.31656 |
| 방림 | 0.44304 |
| 쌍용차 | 0.78904 |
| 유니온스틸 | 0.49747 |
| 미창석유 | 0.75583 |
| 포스코켐텍 | 0.60019 |
| 한성기업 | 0.72489 |
| 코리안리 | 0.53809 |
| 삼영화학 | 0.77943 |
| 진양산업 | 0.753 |
| 에이스침대 | 0.4401 |
| 대한화섬 | 0.20279 |
| 보령제약 | 0.78002 |
| 남양유업 | 0.27956 |
| 남양유업우 | 0.1036 |
| 삼양제넥스 | 0.46439 |
| 삼양제넥우 | 0.30156 |
| 사조대림 | 0.53381 |
| 사조대림우 | 0.81205 |
| 삼성정밀화학 | 0.64296 |
| 현대제철 | 0.62341 |
| SG세계물산 | 0.8644 |
| 신흥 | 0.30058 |
| 한국석유 | 0.81163 |
| 태양금속 | 0.59749 |
| 태양금속우 | 0.60737 |
| 대덕GDS | 0.70088 |
| 대덕GDS우 | 0.45434 |
| 동방 | 0.69391 |
| 한솔제지 | 0.6486 |
| 신세계 | 0.39201 |
| 고려개발 | 0.62363 |
| NPC | 0.54965 |
| NPC우 | 0.56142 |
| 남성 | 0.29924 |
| 현대약품 | 0.71427 |
| 울트라건설 | 0.66367 |
| 울트라건설우 | 0.69936 |
| 세방 | 0.58216 |
| 세방우 | 0.31437 |
| 세방2우B | -0.01361 |
| 농심 | 0.5481 |
| 삼익THK | 0.65893 |
| 서울식품 | 0.78192 |
| 서울식품우 | 0.80907 |
| 송원산업 | 0.63798 |
| 삼화왕관 | 0.39964 |
| 세방전지 | 0.57042 |
| 깨끗한나라 | 0.58911 |
| 깨끗한나라우 | 0.68292 |
| 현대비앤지스틸 | 0.80042 |
| 현대비앤지스틸우 | 0.77718 |
| 한국가구 | 0.63095 |
| 삼천리 | 0.63786 |
| 조광피혁 | 0.26807 |
| 한솔테크닉스 | 0.7549 |
| 우리들제약 | 0.88439 |
| 보루네오 | 0.43157 |
| 써니전자 | 0.83254 |
| 대륙제관 | 0.52033 |
| 효성 | 0.55145 |
| 덕성 | 0.69983 |
| 덕성우 | 0.61128 |
| DRB동일 | 0.7133 |
| 티웨이홀딩스 | 0.60134 |
| 동일산업 | 0.50807 |
| 조광페인트 | 0.71844 |
| 삼영홀딩스 | 0.48659 |
| 한신공영 | 0.64316 |
| 한신공영우 | 0.76141 |
| 신라교역 | 0.64376 |
| 성신양회 | 0.86759 |
| 성신양회우 | 0.53712 |
| 성신양회2우B | 0.29465 |
| 롯데제과 | 0.18786 |
| 휴스틸 | 0.798 |
| 부산주공 | 0.62331 |
| 코스모신소재 | 0.55668 |
| 삼광글라스 | 0.28807 |
| 한창 | 0.77873 |
| 동국산업 | 0.70677 |
| 빙그레 | 0.73648 |
| 동성화학 | 0.8154 |
| 녹십자홀딩스 | 0.34801 |
| 녹십자홀딩스1우 | 0.44571 |
| 동진쎄미켐 | 0.64833 |
| 롯데칠성 | 0.09707 |
| 롯데칠성우 | 0.68247 |
| 국동 | 0.70153 |
| 모나미 | 0.73843 |
| 현대차 | 0.44647 |
| 현대차우 | 0.5063 |
| 현대차2우B | 0.43538 |
| 현대차3우B | 0.12679 |
| 신성통상 | 0.82783 |
| 코스모화학 | 0.74015 |
| 한국공항 | 0.33925 |
| 현대그린푸드 | 0.45442 |
| 신한 | 0.55961 |
| POSCO | 0.18756 |
| 삼진제약 | 0.73485 |
| JS전선 | 0.30915 |
| 삼립식품 | 0.71203 |
| 대성합동지주 | 0.58514 |
| 푸드웰 | 0.64772 |
| 삼영전자 | 0.56844 |
| 파미셀 | 0.76793 |
| 대원산업 | 0.44836 |
| 넥센 | 0.00355 |
| 크라운제과 | 0.47754 |
| 크라운제우 | 0.41103 |
| 대림B&Co | 0.75965 |
| 신영와코루 | 0.58407 |
| 풍산홀딩스 | 0.40685 |
| 원림 | 0.52625 |
| 동부화재 | 0.40408 |
| 에스엘 | 0.6093 |
| 한일사료 | 0.72263 |
| 휴니드 | 0.67672 |
| 대한해운 | 0.3058 |
| 동양건설 | 0.0159 |
| 삼성전자 | 0.51311 |
| 삼성전자우 | 0.2982 |
| 우리투자증권 | 0.74279 |
| 우리투자증권우 | 0.59603 |
| 이수화학 | 0.51736 |
| 동부건설 | 0.28011 |
| 동부건설우 | 0.42958 |
| 성지건설 | 0.71813 |
| 매일유업 | 0.68858 |
| 동원산업 | 0.49947 |
| 국영지앤엠 | 0.67728 |
| 화승인더 | 0.77859 |
| 사조오양 | 0.58012 |
| 삼아알미늄 | 0.70485 |
| SK케미칼 | 0.63729 |
| SK케미칼우 | 0.75251 |
| 피제이전자 | 0.72036 |
| 한국전자홀딩스 | 0.59536 |
| 제주은행 | 0.28244 |
| LS | 0.59065 |
| 녹십자 | 0.76124 |
| 대원전선 | 0.7636 |
| 대원전선우 | 0.63664 |
| GS건설 | 0.37767 |
| 대구백화점 | 0.58209 |
| 대구백화우 | 0.8022 |
| 카프로 | 0.58949 |
| 현대시멘트 | 0.69531 |
| 삼성SDI | 0.76733 |
| 삼성SDI우 | 0.58035 |
| 로엔케이 | 0.74664 |
| 대림통상 | 0.57888 |
| 대양제지 | 0.449 |
| 대한유화 | 0.59114 |
| 삼성공조 | 0.40807 |
| 서부T&D | 0.42373 |
| 영풍제지 | 0.44858 |
| 대우증권 | 0.68207 |
| 대우증권우 | 0.51643 |
| AK홀딩스 | 0.73396 |
| 태경화학 | 0.65882 |
| 보성파워텍 | 0.73643 |
| 모헨즈 | 0.72764 |
| 우성사료 | 0.86586 |
| GS리테일 | 0.16909 |
| 일신석재 | 0.77523 |
| 디올메디바이오 | 0.56883 |
| 사조산업 | 0.46172 |
| 한솔아트원제지 | 0.188 |
| 한솔아트원제지2우B | 0.77335 |
| 벽산 | 0.24669 |
| 한국특수형강 | 0.49665 |
| 오뚜기 | 0.75813 |
| 푸른저축은행 | 0.57419 |
| 동아타이어 | 0.48457 |
| 진양제약 | 0.66636 |
| 네이처셀 | 0.68409 |
| 영신금속 | 0.45901 |
| 샘표식품 | 0.50053 |
| 일양약품 | 0.69134 |
| 일양약품우 | 0.4798 |
| 동방아그로 | 0.11898 |
| 동방아그우 | 0.82326 |
| 선도전기 | 0.76882 |
| 지에스인스트루 | 0.29732 |
| 이수페타시스 | 0.74873 |
| 국도화학 | 0.53725 |
| F&F | 0.54912 |
| 대명엔터프라이즈 | 0.52669 |
| 한일화학 | 0.42651 |
| 코리아써키트 | 0.75942 |
| 코리아써우 | 0.46536 |
| 코리아써키트2우B | 0.80575 |
| 신흥기계 | 0.5395 |
| 한일이화 | 0.70412 |
| 태평양물산 | 0.53407 |
| 웅진케미칼 | 0.70414 |
| 경남에너지 | 0.12525 |
| 동아원 | 0.77557 |
| 대덕전자 | 0.69892 |
| 대동전자 | 0.43149 |
| 이건산업 | 0.79564 |
| NI스틸 | 0.73128 |
| 원풍물산 | 0.65389 |
| 남선알미늄 | 0.74556 |
| 남선알미우 | 0.71029 |
| 원풍 | 0.66724 |
| 문배철강 | 0.66638 |
| 부스타 | 0.68554 |
| 서흥캅셀 | 0.64835 |
| 일정실업 | 0.52506 |
| 메리츠종금증권 | 0.69043 |
| 윌비스 | 0.81807 |
| 아남전자 | 0.83617 |
| 아남전자우 | 0.79645 |
| 삼양엔텍 | 0.08769 |
| 율촌화학 | 0.75686 |
| 호텔신라 | 0.57169 |
| 호텔신라우 | 0.81984 |
| 행남자기 | 0.59875 |
| 대동기어 | 0.42467 |
| 금비 | 0.40726 |
| 티이씨앤코 | 0.74576 |
| 한미사이언스 | 0.70213 |
| 동양철관 | 0.79385 |
| 동양철관우 | 0.83829 |
| KCTC | 0.74502 |
| 경인전자 | 0.4527 |
| 삼성전기 | 0.68867 |
| 삼성전기우 | 0.65236 |
| SIMPAC | 0.66212 |
| 한솔CSN | 0.72191 |
| 대양금속 | 0.51306 |
| 무림페이퍼 | 0.80271 |
| 한샘 | 0.82152 |
| 신원 | 0.61749 |
| 신원우 | 0.62539 |
| 광동제약 | 0.77154 |
| 삼아제약 | 0.6449 |
| 참엔지니어링 | 0.66608 |
| 대우부품 | 0.68639 |
| 태영건설 | 0.32309 |
| 태영건설우 | 0.48034 |
| 한올바이오파마 | 0.77008 |
| KC그린홀딩스 | 0.73183 |
| 경동나비엔 | 0.58454 |
| 한창제지 | 0.78796 |
| 삼화전기 | 0.85086 |
| 포스코엠텍 | 0.66175 |
| 현대중공업 | 0.67325 |
| 무림P&P | 0.7193 |
| 삼보산업 | 0.68909 |
| 모토닉 | 0.62336 |
| DS제강 | 0.5863 |
| 삼정펄프 | 0.47499 |
| 엠에스씨 | 0.51123 |
| 고려포리머 | 0.58894 |
| 고려포리머우 | 0.74638 |
| 한화케미칼 | 0.41216 |
| 한화케미칼우 | 0.50824 |
| 영원무역홀딩스 | 0.30195 |
| 한국내화 | 0.76913 |
| 우리종금 | 0.52886 |
| OCI | 0.68099 |
| 한국프랜지 | 0.73264 |
| LS산전 | 0.6054 |
| 고려아연 | 0.62524 |
| 삼성중공업 | 0.45503 |
| 삼성중공우 | 0.82861 |
| 대한광통신 | 0.43959 |
| 흥국 | 0.62111 |
| 쌍용정보통신 | 0.72764 |
| 한솔PNS | 0.62004 |
| 오리콤 | 0.57107 |
| 현대하이스코 | 0.4626 |
| 지코 | 0.58123 |
| 와이비로드 | 0.73712 |
| 현대미포조선 | 0.73945 |
| 진양폴리 | 0.63393 |
| 화천기계 | 0.71641 |
| 나노트로닉스 | 0.33605 |
| 화신 | 0.76421 |
| 평화홀딩스 | 0.42435 |
| 아이에스동서 | 0.78224 |
| 퍼스텍 | 0.82029 |
| S-Oil | 0.64707 |
| S-Oil우 | 0.35249 |
| 삼호개발 | 0.73256 |
| VGX인터 | 0.678 |
| 경동제약 | 0.52365 |
| LG이노텍 | 0.67023 |
| 우성I&C | 0.58069 |
| 에넥스 | 0.80425 |
| CJ씨푸드 | 0.73068 |
| CJ씨푸드1우 | 0.79803 |
| 두산건설 | 0.1934 |
| 롯데케미칼 | 0.68972 |
| 현대상선 | 0.70356 |
| 현대위아 | 0.52411 |
| 삼화전자 | 0.76712 |
| 태림포장 | 0.71318 |
| 성안 | 0.7487 |
| 유니크 | 0.58651 |
| 유니켐 | 0.52754 |
| 서한 | 0.81898 |
| 부산산업 | 0.74915 |
| IB월드와이드 | 0.68137 |
| 한농화성 | 0.61441 |
| 세보엠이씨 | 0.54719 |
| 유양디앤유 | 0.7468 |
| 한신기계 | 0.81189 |
| 현대상사 | 0.61365 |
| 금호석유 | 0.76926 |
| 금호석유우 | 0.44335 |
| SKC | 0.59639 |
| STX | 0.5846 |
| 신성솔라에너지 | 0.62485 |
| 동부CNI | 0.52329 |
| 영흥철강 | 0.685 |
| 키스톤글로벌 | 0.46572 |
| 계양전기 | 0.84634 |
| 계양전기우 | 0.73152 |
| 영화금속 | 0.85932 |
| 경동가스 | 0.15616 |
| 현대모비스 | 0.49328 |
| 현대모비스우 | 0.56994 |
| 뉴인텍 | 0.7001 |
| 삼성테크윈 | 0.62065 |
| 더존비즈온 | 0.74425 |
| 청호컴넷 | 0.52299 |
| 경인양행 | 0.77576 |
| 원일특강 | 0.80824 |
| 현대산업 | 0.59822 |
| 모나리자 | 0.77722 |
| 리드코프 | 0.76447 |
| 에스원 | 0.43968 |
| 신일제약 | 0.57162 |
| 대창 | 0.7927 |
| 대창우 | 0.81705 |
| 대동 | 0.68099 |
| 세우글로벌 | 0.72609 |
| 세우글로벌우 | 0.71128 |
| 하이록코리아 | 0.36947 |
| 동원개발 | 0.50554 |
| AJS | 0.72264 |
| 일성건설 | 0.71204 |
| 일성건설2우B | 0.73032 |
| 동성하이켐 | 0.63383 |
| 화승알앤에이 | 0.57942 |
| 동양기전 | 0.61523 |
| 계룡건설 | 0.73817 |
| 삼환까뮤 | 0.51503 |
| 청보산업 | 0.83796 |
| 스페코 | 0.8329 |
| 지엠비코리아 | 0.44052 |
| 아가방컴퍼니 | 0.80629 |
| 보령메디앙스 | 0.72893 |
| 한익스프레스 | 0.55241 |
| 대영포장 | 0.8025 |
| 원익큐브 | 0.68303 |
| 광림 | 0.80697 |
| 금강공업 | 0.89883 |
| 금강공업우 | 0.83592 |
| 영보화학 | 0.6296 |
| 리홈쿠첸 | 0.80238 |
| 극동유화 | 0.52003 |
| 고려제약 | 0.74254 |
| 백광소재 | 0.69541 |
| 성광벤드 | 0.55051 |
| 한솔케미칼 | 0.42807 |
| 사조씨푸드 | 0.78638 |
| 한라 | 0.68653 |
| 동원시스템즈 | 0.61725 |
| 동원시스템즈우 | 0.4167 |
| 유니드 | 0.30289 |
| 성문전자 | 0.70827 |
| 성문전자우 | 0.67001 |
| 오리엔탈정공 | 0.33093 |
| 삼륭물산 | 0.76685 |
| 인디에프 | 0.71467 |
| 이스타코 | 0.86505 |
| 대창단조 | 0.61613 |
| 에이엔피 | 0.75056 |
| 부산가스 | -0.04424 |
| 예스코 | 0.1637 |
| 트랜스더멀아시아홀딩 | 0.71304 |
| 대경기계 | 0.62062 |
| 코콤 | 0.82171 |
| 성우하이텍 | 0.62333 |
| 한국전력 | 0.39255 |
| 일진홀딩스 | 0.7931 |
| 태경산업 | 0.77348 |
| 대현 | 0.75455 |
| 산성앨엔에스 | 0.71342 |
| 로엔 | 0.6568 |
| 이테크건설 | 0.21266 |
| 삼성증권 | 0.67869 |
| 동부제철 | 0.51852 |
| 동부제철우 | 0.6592 |
| NH농협증권 | 0.76422 |
| 한세예스24홀딩스 | 0.67681 |
| 환인제약 | 0.60605 |
| 신대양제지 | 0.57178 |
| 큐캐피탈 | 0.69711 |
| 동부증권 | 0.6189 |
| 포비스티앤씨 | 0.71928 |
| 대성홀딩스 | 0.42943 |
| 퍼시스 | 0.12183 |
| 웅진홀딩스 | 0.64962 |
| 카스 | 0.7408 |
| 신원종합개발 | 0.85936 |
| 광명전기 | 0.80063 |
| 명문제약 | 0.81731 |
| 인터엠 | 0.62154 |
| 우신시스템 | 0.66312 |
| 서울가스 | 0.44763 |
| 삼현철강 | 0.69005 |
| 세명전기 | 0.62097 |
| 수산중공업 | 0.76346 |
| 수산중공우 | 0.79307 |
| 대림제지 | 0.61881 |
| SK텔레콤 | 0.5354 |
| 데코네티션 | 0.29396 |
| 현대엘리베이 | 0.67721 |
| 풀무원홀딩스 | 0.70914 |
| 한국알콜 | 0.64248 |
| 광전자 | 0.3571 |
| E1 | 0.15023 |
| 한국카본 | 0.39098 |
| 유니슨 | 0.75067 |
| 진로발효 | 0.63461 |
| 지엠피 | 0.86536 |
| 삼목에스폼 | 0.57537 |
| 조일알미늄 | 0.80691 |
| 동원금속 | 0.6099 |
| 우진비앤지 | 0.69939 |
| SK가스 | 0.19632 |
| 서울제약 | 0.78859 |
| 바른손 | 0.79577 |
| 한라비스테온공조 | 0.31809 |
| 그랜드백화점 | 0.22065 |
| 신풍제약 | 0.64558 |
| 신풍제약우 | 0.45324 |
| 티에이치엔 | 0.68339 |
| 와이지-원 | 0.68288 |
| 동일제지 | 0.53552 |
| 세아특수강 | 0.61179 |
| 하이트론 | 0.52625 |
| 일지테크 | 0.59063 |
| SBI인베스트먼트 | 0.74424 |
| 제미니투자 | 0.73933 |
| 엠벤처투자 | 0.71305 |
| 베리타스 | 0.39191 |
| 대교 | 0.57067 |
| 대교우B | 0.1603 |
| 탑금속 | 0.65612 |
| 에너토크 | 0.42799 |
| 한섬 | 0.43524 |
| 다우인큐브 | 0.28377 |
| 일진머티리얼즈 | 0.77404 |
| 대신정보통신 | 0.84502 |
| 아시아나항공 | 0.6241 |
| 시공테크 | 0.72852 |
| 일진디스플 | 0.69077 |
| 대호피앤씨 | 0.63172 |
| 대호피앤씨우 | 0.60093 |
| 서원 | 0.63059 |
| 에이티넘인베스트 | 0.8153 |
| 코웨이 | 0.46008 |
| KCC건설 | 0.34685 |
| 한국큐빅 | 0.38121 |
| 세원정공 | 0.42682 |
| 우리파이낸셜 | 0.35734 |
| 포스코 ICT | 0.68465 |
| 애강리메텍 | 0.63259 |
| 삼원강재 | 0.59885 |
| MH에탄올 | 0.65314 |
| 태광 | 0.62668 |
| 한국종합기술 | 0.65058 |
| 유진기업 | 0.75929 |
| 인테그레이티드에너지 | 0.54903 |
| 제일제강 | 0.35549 |
| 동남합성 | 0.8512 |
| CNH | 0.68063 |
| 롯데쇼핑 | 0.59187 |
| 다우기술 | 0.46 |
| 삼보판지 | 0.84467 |
| 한국캐피탈 | 0.7703 |
| 플레이위드 | 0.29757 |
| 동일철강 | 0.56084 |
| 인지컨트롤스 | 0.62736 |
| 인팩 | 0.78582 |
| 아트라스BX | 0.36679 |
| 풍국주정 | 0.52161 |
| 대한약품 | 0.62902 |
| 에쓰씨엔지니어링 | 0.14758 |
| 흥구석유 | 0.5972 |
| WISCOM | 0.39067 |
| 디씨엠 | 0.43977 |
| 기업은행 | 0.13793 |
| KB오토시스 | 0.57602 |
| 하림홀딩스 | 0.78759 |
| 한국콜마홀딩스 | 0.72949 |
| 한일단조 | 0.62841 |
| 유성티엔에스 | 0.84275 |
| 이화전기 | 0.78594 |
| 세원물산 | 0.35904 |
| 갑을메탈 | 0.6664 |
| 피에스엠씨 | 0.71849 |
| 케이피에프 | 0.77813 |
| 대원화성 | 0.62935 |
| 덕양산업 | 0.76245 |
| 경창산업 | 0.54231 |
| PN풍년 | 0.68878 |
| 삼천리자전거 | 0.72869 |
| KPX케미칼 | 0.08437 |
| 부산방직 | 0.67812 |
| 시노펙스 | 0.7743 |
| 대성엘텍 | 0.71221 |
| SJM홀딩스 | 0.49545 |
| 한국단자 | 0.55119 |
| 한국선재 | 0.64399 |
| 미래산업 | 0.91451 |
| 신우 | 0.78064 |
| 한솔홈데코 | 0.85544 |
| 한국정보통신 | 0.74016 |
| 이구산업 | 0.73235 |
| KPX화인케미칼 | 0.57423 |
| 남해화학 | 0.57213 |
| 신라에스지 | 0.74044 |
| 케이씨피드 | 0.8194 |
| 한국주강 | 0.75351 |
| 동신건설 | 0.52319 |
| 에머슨퍼시픽 | 0.84439 |
| 로만손 | 0.72261 |
| 특수건설 | 0.6806 |
| 현대정보기술 | 0.64412 |
| 디피씨 | 0.7289 |
| 광진실업 | 0.57619 |
| 부국철강 | 0.66634 |
| 동서 | 0.63514 |
| 서울전자통신 | 0.55788 |
| 코리아나 | 0.77694 |
| 한화타임월드 | 0.40604 |
| 상보 | 0.76597 |
| 팜스토리 | 0.77505 |
| 마니커 | 0.66569 |
| 대성창투 | 0.737 |
| 세하 | 0.65855 |
| 파캔OPC | 0.18356 |
| 삼성엔지니어링 | 0.49027 |
| 휴맥스홀딩스 | 0.77396 |
| 동아지질 | 0.74449 |
| GS홈쇼핑 | 0.56408 |
| 에이치엘비 | 0.67899 |
| 에이치엘비우 | 0.81995 |
| STX팬오션 | 0.63512 |
| 케이씨텍 | 0.65252 |
| 케이디씨 | 0.68196 |
| 신도리코 | 0.1524 |
| 삼성카드 | 0.08873 |
| 코엔텍 | 0.82963 |
| 제일기획 | 0.34118 |
| NICE평가정보 | 0.46183 |
| KT | 0.63602 |
| KTB투자증권 | 0.80226 |
| 가희 | 0.50974 |
| 드래곤플라이 | 0.60617 |
| 한글과컴퓨터 | 0.60613 |
| 원익IPS | 0.76836 |
| 교보증권 | 0.81999 |
| 동원수산 | 0.72778 |
| 동양네트웍스 | 0.67104 |
| 양지사 | 0.46548 |
| 아이즈비전 | 0.59343 |
| 에스에이엠티 | 0.71885 |
| 녹십자셀 | 0.55713 |
| 신세계인터내셔날 | 0.39737 |
| 신세계푸드 | 0.57663 |
| 오스템 | 0.8109 |
| 콤텍시스템 | 0.68772 |
| 에이모션 | 0.47509 |
| 피에스케이 | 0.77751 |
| C&S자산관리 | 0.76867 |
| 아즈텍WB | 0.86344 |
| 다우데이타 | 0.57434 |
| 삼일 | 0.71672 |
| 롯데관광개발 | 0.69577 |
| 터보테크 | 0.70364 |
| 케이엠더블유 | 0.84369 |
| TJ미디어 | 0.65796 |
| 황금에스티 | 0.7926 |
| 피델릭스 | 0.73734 |
| 유비케어 | 0.70155 |
| LG유플러스 | 0.75912 |
| 비티씨정보 | 0.74322 |
| 비티씨정보우 | 0.83319 |
| 삼진 | 0.65952 |
| 지아이블루 | 0.75812 |
| G러닝 | 0.69519 |
| 우리기술 | 0.66003 |
| 삼성생명 | 0.24799 |
| 비트컴퓨터 | 0.76832 |
| 자원 | 0.59246 |
| 원익 | 0.36255 |
| 동일기연 | 0.7633 |
| 폴리비전 | 0.26123 |
| 제이엠아이 | 0.67992 |
| 제룡전기 | 0.73129 |
| 이디 | 0.51582 |
| 디지틀조선 | 0.8105 |
| 엠케이전자 | 0.73093 |
| 시그네틱스 | 0.51002 |
| 필룩스 | 0.63106 |
| 모아텍 | 0.81366 |
| 인성정보 | 0.8227 |
| 자화전자 | 0.73197 |
| 체시스 | 0.80674 |
| 유나이티드제약 | 0.67287 |
| 필코전자 | 0.76336 |
| 디케이디앤아이 | 0.70189 |
| 제이씨현 | 0.75776 |
| 좋은사람들 | 0.76799 |
| 한국자원투자개발 | 0.57163 |
| 동성화인텍 | 0.64757 |
| 세종공업 | 0.54366 |
| 파라텍 | 0.73626 |
| 블루콤 | 0.42455 |
| 이젠텍 | 0.72469 |
| SK브로드밴드 | 0.80201 |
| 네패스 | 0.70671 |
| 아주캐피탈 | 0.41849 |
| KT&G | 0.41477 |
| 서화정보통신 | 0.72025 |
| 대구방송 | 0.22285 |
| 무학 | 0.505 |
| 두산중공업 | 0.29087 |
| SBS | 0.49999 |
| LG디스플레이 | 0.66977 |
| 파라다이스 | 0.57168 |
| 신세계건설 | 0.5609 |
| NICE | 0.44743 |
| 인천도시가스 | 0.49032 |
| SK C&C | 0.57794 |
| 해성산업 | 0.4351 |
| 한국토지신탁 | 0.67983 |
| 조아제약 | 0.7173 |
| 한국기업평가 | 0.33666 |
| GⅡR | 0.27967 |
| 인터파크 | 0.73088 |
| 백산 | 0.61905 |
| 프럼파스트 | 0.67694 |
| 강원랜드 | 0.64857 |
| 에듀박스 | 0.39186 |
| NAVER | 0.74142 |
| 기산텔레콤 | 0.68655 |
| 제이비어뮤즈먼트 | 0.46059 |
| 신세계 I&C | 0.50218 |
| KG이니시스 | 0.63673 |
| 솔본 | 0.7519 |
| 바른손게임즈 | 0.75931 |
| 다음 | 0.36591 |
| CJ오쇼핑 | 0.39446 |
| 이지바이오 | 0.7257 |
| 서희건설 | 0.76807 |
| JYP Ent. | 0.74622 |
| 예림당 | 0.74169 |
| 아비코전자 | 0.55502 |
| KTH | 0.75123 |
| 위지트 | 0.75073 |
| 서울신용평가 | 0.56295 |
| 씨티엘 | 0.51013 |
| 영인프런티어 | 0.63928 |
| 금화피에스시 | 0.52498 |
| 유니셈 | 0.69545 |
| 태산엘시디 | 0.78548 |
| 인포피아 | 0.75371 |
| 웰메이드 | 0.46044 |
| 제이콘텐트리 | 0.67067 |
| 한국가스공사 | 0.71484 |
| 대성미생물 | 0.53652 |
| OCI머티리얼즈 | 0.68124 |
| 유원컴텍 | 0.68939 |
| S&T홀딩스 | 0.53291 |
| STS반도체 | 0.71471 |
| 영풍정밀 | 0.639 |
| 엔씨소프트 | 0.74953 |
| 팜스코 | 0.33738 |
| 버추얼텍 | 0.64952 |
| 온세텔레콤 | 0.71377 |
| HRS | 0.59136 |
| KCI | 0.86516 |
| 코맥스 | 0.55922 |
| 심텍 | 0.66642 |
| 나이스정보통신 | 0.80629 |
| 에프에스티 | 0.6993 |
| 솔브레인 | 0.44755 |
| 진성티이씨 | 0.52221 |
| 주성엔지니어링 | 0.65737 |
| 파세코 | 0.72135 |
| 한국팩키지 | 0.78777 |
| 휘닉스컴 | 0.51982 |
| 인지디스플레 | 0.7562 |
| 네오아레나 | 0.72613 |
| 성도이엔지 | 0.76366 |
| EG | 0.83362 |
| 우리조명지주 | 0.63453 |
| 희림 | 0.54205 |
| 삼지전자 | 0.58694 |
| CJ헬로비전 | 0.3991 |
| 미래에셋증권 | 0.57789 |
| 광주신세계 | 0.22846 |
| 쎄니트 | 0.7654 |
| 제일테크노스 | 0.47836 |
| 서린바이오 | 0.77534 |
| 에코플라스틱 | 0.65983 |
| 마크로젠 | 0.80403 |
| 쓰리원 | 0.37697 |
| 레드캡투어 | 0.69588 |
| 바이오스마트 | 0.48825 |
| 동양시멘트 | 0.68289 |
| 코아크로스 | 0.62906 |
| 텍셀네트컴 | 0.70576 |
| 위즈정보기술 | 0.68145 |
| 에스넷 | 0.80676 |
| 에코에너지 | 0.62148 |
| 파인디지털 | 0.77207 |
| 현대통신 | 0.82545 |
| 이건창호 | 0.7096 |
| 이오테크닉스 | 0.48801 |
| 하나투어 | 0.66295 |
| 오스코텍 | 0.47098 |
| 솔브레인이엔지 | 0.61323 |
| 경남스틸 | 0.76185 |
| 인포뱅크 | 0.77081 |
| 세중 | 0.70169 |
| 한국경제TV | 0.64313 |
| 케이엘넷 | 0.66668 |
| 에스티아이 | 0.84043 |
| 키움증권 | 0.46428 |
| 씨앤케이인터 | 0.63423 |
| 다산네트웍스 | 0.73851 |
| 화성 | 0.61909 |
| 스포츠서울 | 0.65071 |
| 한국정보공학 | 0.78213 |
| 위노바 | 0.79748 |
| 오로라 | 0.79762 |
| 디오 | 0.80371 |
| 태창파로스 | 0.57294 |
| 나노엔텍 | 0.69943 |
| 리노스 | 0.83269 |
| 누리텔레콤 | 0.71042 |
| YTN | 0.52284 |
| 큐로컴 | 0.72631 |
| 정상제이엘에스 | 0.56548 |
| SG&G | 0.76896 |
| 와이즈파워 | 0.70603 |
| 아이씨디 | 0.65034 |
| 인프라웨어 | 0.70038 |
| 게임하이 | 0.82238 |
| 우리기술투자 | 0.84572 |
| 에버다임 | 0.64962 |
| 한국전자인증 | 0.77944 |
| 에스엠 | 0.56082 |
| 이라이콤 | 0.70029 |
| GemTech | 0.82907 |
| 상신브레이크 | 0.74646 |
| 바이오스페이스 | 0.76282 |
| 에스텍파마 | 0.68639 |
| 동아화성 | 0.61774 |
| 코미팜 | 0.6732 |
| 에스씨디 | 0.6044 |
| 비츠로테크 | 0.71704 |
| 네오위즈홀딩스 | 0.77657 |
| 링네트 | 0.71954 |
| 라온시큐어 | 0.69626 |
| 한스바이오메드 | 0.62084 |
| 새로닉스 | 0.66546 |
| 대우조선해양 | 0.39279 |
| 두산인프라코어 | 0.68607 |
| 한미반도체 | 0.66078 |
| 르네코 | 0.32302 |
| 팜스웰바이오 | 0.73466 |
| 솔고바이오 | 0.81499 |
| 바텍 | 0.78769 |
| 파루 | 0.7666 |
| 경원산업 | 0.05336 |
| 성호전자 | 0.64791 |
| 케이맥 | 0.77526 |
| 에쎈테크 | 0.52099 |
| 디지아이 | 0.70805 |
| 평화정공 | 0.54446 |
| 에임하이 | 0.55944 |
| 크로바하이텍 | 0.78252 |
| KT뮤직 | 0.73469 |
| 국순당 | 0.79909 |
| 다스텍 | 0.42725 |
| 자연과환경 | 0.79058 |
| 조광ILI | 0.7671 |
| 국제디와이 | 0.72559 |
| 위닉스 | 0.75278 |
| 주연테크 | 0.81472 |
| KSS해운 | 0.66472 |
| 유니더스 | 0.75362 |
| 태웅 | 0.73405 |
| 한광 | 0.65194 |
| 코스맥스 | 0.74111 |
| 이-글 벳 | 0.82818 |
| 오공 | 0.86579 |
| 한양이엔지 | 0.666 |
| 성우테크론 | 0.47254 |
| 토탈소프트 | 0.43358 |
| 대아티아이 | 0.79945 |
| 정원엔시스 | 0.75555 |
| 크린앤사이언스 | 0.65858 |
| 에이텍 | 0.68978 |
| 동부라이텍 | 0.57894 |
| 비에스이 | 0.48989 |
| 코다코 | 0.69175 |
| 한일네트웍스 | 0.80709 |
| 오르비텍 | 0.61669 |
| SBS콘텐츠허브 | 0.67917 |
| 파나진 | 0.59853 |
| 백금T&A | 0.69797 |
| 삼화네트웍스 | 0.86372 |
| 디브이에스 | 0.63391 |
| KG모빌리언스 | 0.74936 |
| 서울반도체 | 0.59808 |
| 우원개발 | 0.51238 |
| 우리로광통신 | 0.70898 |
| 대우건설 | 0.6982 |
| 대우인터내셔널 | 0.75042 |
| 한빛소프트 | 0.72785 |
| 파워로직스 | 0.67432 |
| 쌍용머티리얼 | 0.5343 |
| 레이젠 | 0.60674 |
| 이스트소프트 | 0.65094 |
| 코데즈컴바인 | 0.7447 |
| 한국항공우주 | 0.54344 |
| 초록뱀 | 0.69955 |
| 오스템임플란트 | 0.77888 |
| 현대아이비티 | 0.59933 |
| 유라테크 | 0.66187 |
| 대동스틸 | 0.83308 |
| 인트론바이오 | 0.53525 |
| SM C&C | 0.70891 |
| TPC | 0.86036 |
| 엔피케이 | 0.67754 |
| 코아로직 | 0.29792 |
| 대원미디어 | 0.64387 |
| 인탑스 | 0.72101 |
| 파인디앤씨 | 0.36641 |
| 셀루메드 | 0.74767 |
| 코메론 | 0.7945 |
| SGA | 0.77811 |
| 오픈베이스 | 0.845 |
| 유아이엘 | 0.71984 |
| 잉크테크 | 0.78686 |
| 재영솔루텍 | 0.77886 |
| 고려신용정보 | 0.54196 |
| 동원F&B | 0.72068 |
| 우진플라임 | 0.55792 |
| 승일 | 0.4561 |
| 미래컴퍼니 | 0.78116 |
| 쎌바이오텍 | 0.7827 |
| 휘닉스소재 | 0.65099 |
| 캠시스 | 0.76838 |
| 라이브플렉스 | 0.64976 |
| 아남정보기술 | 0.81212 |
| 엠피씨 | 0.55264 |
| 에스폴리텍 | 0.59527 |
| 아세아텍 | 0.7536 |
| 쏠리드 | 0.70935 |
| 지어소프트 | 0.31926 |
| 루보 | 0.61425 |
| 포스코플랜텍 | 0.21915 |
| 토비스 | 0.41333 |
| 인터플렉스 | 0.57529 |
| 피씨디렉트 | 0.50884 |
| 영우통신 | 0.70345 |
| 나라엠앤디 | 0.62922 |
| CJ프레시웨이 | 0.51104 |
| 한전KPS | 0.2626 |
| 진양화학 | 0.65927 |
| 큐로홀딩스 | 0.5569 |
| LG생활건강 | 0.49263 |
| LG생활건강우 | 0.3945 |
| LG화학 | 0.61637 |
| LG화학우 | 0.53691 |
| SNH | 0.5797 |
| 에스티큐브 | 0.61571 |
| 소프트맥스 | 0.65771 |
| iMBC | 0.75809 |
| 바이오랜드 | 0.75299 |
| 우전앤한단 | 0.56112 |
| 트레이스 | 0.56588 |
| 승화산업 | 0.70094 |
| 코텍 | 0.61227 |
| 코나아이 | 0.72229 |
| 오성엘에스티 | 0.40279 |
| 아이크래프트 | 0.70389 |
| 한네트 | 0.71893 |
| 제일바이오 | 0.87536 |
| 한전기술 | 0.4092 |
| 아모텍 | 0.70376 |
| 와이디온라인 | 0.83177 |
| 액토즈소프트 | 0.58852 |
| 아이앤씨 | 0.67779 |
| 비아이이엠티 | 0.58865 |
| 우리금융 | 0.62964 |
| 바이넥스 | 0.72629 |
| 지에스이 | 0.47211 |
| 세동 | 0.36604 |
| 소리바다 | 0.73265 |
| 프리엠스 | 0.80157 |
| 스카이라이프 | 0.55362 |
| 금강철강 | 0.61314 |
| 구영테크 | 0.64164 |
| 예스24 | 0.78965 |
| 능률교육 | 0.68275 |
| 이니텍 | 0.637 |
| 세코닉스 | 0.75563 |
| 한국테크놀로지 | 0.64607 |
| 프로텍 | 0.59609 |
| 태양 | 0.78154 |
| 현진소재 | 0.56808 |
| 한미글로벌 | 0.54815 |
| 삼보모터스 | 0.20376 |
| 국제엘렉트릭 | 0.50926 |
| 안랩 | 0.84495 |
| GT&T | 0.62513 |
| 경남제약 | 0.47858 |
| 오상자이엘 | 0.60638 |
| 한국컴퓨터 | 0.73759 |
| 농우바이오 | 0.6142 |
| 삼진엘앤디 | 0.74499 |
| 중앙오션 | 0.66233 |
| 이랜텍 | 0.77825 |
| 비츠로시스 | 0.81284 |
| 헤스본 | 0.5044 |
| 피앤텔 | 0.7655 |
| 케이피티 | 0.54901 |
| 텔레칩스 | 0.633 |
| 삼영엠텍 | 0.69011 |
| AP시스템 | 0.73629 |
| 에이디칩스 | 0.59721 |
| 대한뉴팜 | 0.77698 |
| 키이스트 | 0.87575 |
| 아이디스홀딩스 | 0.44074 |
| 소프트포럼 | 0.80154 |
| 유신 | 0.49553 |
| 엑사이엔씨 | 0.70309 |
| 제이브이엠 | 0.54516 |
| 신한지주 | 0.29255 |
| 코원 | 0.77822 |
| 유진로봇 | 0.7796 |
| 에스에프에이 | 0.35395 |
| CU전자 | 0.81039 |
| 코위버 | 0.71682 |
| 신화인터텍 | 0.74314 |
| 아큐픽스 | 0.65578 |
| YBM시사닷컴 | 0.09157 |
| 현대홈쇼핑 | 0.4241 |
| SKC 솔믹스 | 0.19586 |
| 옴니시스템 | 0.72867 |
| 옴니텔 | 0.63517 |
| 토필드 | 0.69068 |
| 아리온 | 0.58903 |
| 금성테크 | 0.70078 |
| KNN | 0.08383 |
| 제이웨이 | 0.57136 |
| 포스코강판 | 0.48103 |
| 일야 | 0.5766 |
| 리노공업 | 0.35969 |
| 이큐스앤자루 | 0.57514 |
| 에스피지 | 0.59315 |
| 엠게임 | 0.7435 |
| 세아홀딩스 | 0.06239 |
| 동아에스텍 | 0.6939 |
| CMG제약 | 0.72903 |
| KTcs | 0.65143 |
| 케이티스 | 0.71328 |
| 미코 | 0.71118 |
| 아이컴포넌트 | 0.71522 |
| 메타바이오메드 | 0.72805 |
| 인선이엔티 | 0.4938 |
| 이그잭스 | 0.45254 |
| 아이넷스쿨 | 0.56283 |
| 한국사이버결제 | 0.71783 |
| 뉴보텍 | 0.75622 |
| 큐렉소 | 0.62451 |
| 레드로버 | 0.64711 |
| 3S | 0.64955 |
| KT서브마린 | 0.671 |
| 동양에스텍 | 0.71077 |
| 에스에이티 | 0.5233 |
| 홈센타 | 0.50858 |
| 아이리버 | 0.63524 |
| 씨티씨바이오 | 0.7811 |
| KH바텍 | 0.81238 |
| 에어파크 | 0.45937 |
| 만도 | 0.442 |
| 알에프텍 | 0.70999 |
| 화일약품 | 0.75105 |
| 엘비세미콘 | 0.67343 |
| 티엘아이 | 0.71191 |
| 게임빌 | 0.54546 |
| 종근당바이오 | 0.70075 |
| 서울옥션 | 0.3982 |
| 케이디미디어 | 0.52563 |
| 한국전자금융 | 0.77432 |
| 휴바이론 | 0.54517 |
| 홈캐스트 | 0.82992 |
| 다날 | 0.81391 |
| 인텍플러스 | 0.56893 |
| 브리지텍 | 0.66674 |
| 바른전자 | 0.74564 |
| 바이오니아 | 0.79744 |
| 티씨케이 | 0.6666 |
| 필링크 | 0.63409 |
| 소셜미디어99 | 0.49237 |
| S&T모티브 | 0.32071 |
| 지엔코 | 0.6484 |
| 탑엔지니어링 | 0.61638 |
| MPK | 0.6298 |
| 에프티이앤이 | 0.73352 |
| 엔알디 | 0.70316 |
| 피에스앤지 | 0.56922 |
| 플렉스컴 | 0.78595 |
| 신성델타테크 | 0.57975 |
| 에스아이리소스 | 0.40313 |
| 이루온 | 0.73505 |
| 빅텍 | 0.8381 |
| 오리엔트정공 | 0.52193 |
| 휴비츠 | 0.66354 |
| 전파기지국 | 0.86015 |
| 큐브스 | 0.48693 |
| 삼영이엔씨 | 0.69319 |
| 샤인 | 0.81031 |
| 메디프론 | 0.68838 |
| 우주일렉트로 | 0.55649 |
| 대진디엠피 | 0.66952 |
| 서호전기 | 0.73988 |
| CS | 0.74101 |
| 케이에스씨비 | 0.56407 |
| 웰크론 | 0.77799 |
| 백산OPC | 0.56498 |
| 하츠 | 0.68506 |
| SK컴즈 | 0.77792 |
| 큐에스아이 | 0.62697 |
| 티에스엠텍 | 0.49286 |
| 캔들미디어 | 0.79892 |
| 케이엠알앤씨 | 0.46878 |
| LG전자 | 0.7341 |
| LG전자우 | 0.68375 |
| 우수AMS | 0.66537 |
| 국보디자인 | 0.60363 |
| 디스플레이텍 | 0.77958 |
| 테라젠이텍스 | 0.66994 |
| 씨씨에스 | 0.83171 |
| 디에이피 | 0.68535 |
| 손오공 | 0.73177 |
| 엘앤에프 | 0.63194 |
| 하이쎌 | 0.82588 |
| 조이시티 | 0.78749 |
| 이씨에스 | 0.62206 |
| 대화제약 | 0.75027 |
| 아프리카TV | 0.90121 |
| 오텍 | 0.74952 |
| STX조선해양 | 0.61949 |
| 크레듀 | 0.71973 |
| JW중외신약 | 0.64182 |
| 하나마이크론 | 0.68819 |
| 에너지솔루션 | 0.647 |
| 세진티에스 | 0.67405 |
| 세이브존I&C | 0.58257 |
| 와이엔텍 | 0.68749 |
| 이글루시큐리티 | 0.72802 |
| 도이치모터스 | 0.36479 |
| 팬엔터테인먼트 | 0.71336 |
| KCW | 0.41433 |
| 엔티피아 | 0.71519 |
| 다원시스 | 0.61396 |
| 셀트리온 | 0.81084 |
| 삼성출판사 | 0.60099 |
| 일신바이오 | 0.6548 |
| AJ렌터카 | 0.44531 |
| 셀트리온제약 | 0.62317 |
| DMS | 0.78704 |
| LG생명과학 | 0.68397 |
| LG생명과학우 | 0.47894 |
| 디지털대성 | 0.62553 |
| 아이씨케이 | 0.54711 |
| 웹젠 | 0.72925 |
| 코스온 | 0.63365 |
| 누리플랜 | 0.6073 |
| 휴켐스 | 0.71522 |
| 유아이디 | 0.69978 |
| 엔텔스 | 0.78092 |
| 대호에이엘 | 0.75798 |
| 에스텍 | 0.34111 |
| 빛과전자 | 0.67156 |
| 대웅제약 | 0.68926 |
| 엠케이트렌드 | 0.61733 |
| KOSEF 200 | 0.1818 |
| DSR제강 | 0.44162 |
| 아이에스이커머스 | 0.71273 |
| 현대백화점 | 0.51314 |
| 솔라시아 | 0.67889 |
| 에버테크노 | 0.47089 |
| 한솔인티큐브 | 0.53488 |
| 한국금융지주 | 0.62607 |
| 한국금융지주우 | 0.48535 |
| 하이스틸 | 0.64291 |
| 인피니트헬스케어 | 0.75545 |
| 로체시스템즈 | 0.54587 |
| 지역난방공사 | 0.53012 |
| 에이테크솔루션 | 0.56135 |
| 롯데하이마트 | 0.60711 |
| 에이스하이텍 | 0.42897 |
| 코아스 | 0.69927 |
| STX중공업 | 0.74251 |
| 중앙백신 | 0.88366 |
| 유엔젤 | 0.75969 |
| 우리산업 | 0.81419 |
| 태양기전 | 0.60705 |
| 농심홀딩스 | 0.4347 |
| 아로마소프트 | 0.62191 |
| 메가스터디 | 0.73128 |
| 빛샘전자 | 0.79116 |
| 케이에스피 | 0.44421 |
| 넥센테크 | 0.86192 |
| 엘엠에스 | 0.6088 |
| 듀오백코리아 | 0.22472 |
| 금호타이어 | 0.31759 |
| 이노와이어리스 | 0.62427 |
| 에프알텍 | 0.62219 |
| 프롬써어티 | 0.61525 |
| 삼원테크 | 0.23354 |
| 디아이디 | 0.7902 |
| 창해에너지어링 | 0.51749 |
| 아미노로직스 | 0.51476 |
| 원익QnC | 0.54778 |
| 이엔쓰리 | 0.51073 |
| 플랜티넷 | 0.79168 |
| 새론오토모티브 | 0.53346 |
| 동국알앤에스 | 0.5731 |
| 웰크론한텍 | 0.6254 |
| 다윈텍 | 0.66312 |
| 덕산하이메탈 | 0.6361 |
| 유니퀘스트 | 0.54333 |
| STX엔진 | 0.74711 |
| 텔코웨어 | 0.60645 |
| 이트레이드증권 | 0.57545 |
| 유비쿼스 | 0.75062 |
| 국일제지 | 0.34738 |
| 대봉엘에스 | 0.7739 |
| HB테크놀러지 | 0.63784 |
| 메디포스트 | 0.83119 |
| 컴투스 | 0.73059 |
| 한양디지텍 | 0.86726 |
| 에이블씨엔씨 | 0.7203 |
| 두올산업 | 0.63762 |
| 대주전자재료 | 0.73288 |
| 코렌 | 0.58387 |
| 아이디에스 | 0.63537 |
| 포인트아이 | 0.56004 |
| 가온미디어 | 0.63096 |
| GS | 0.71966 |
| GS우 | 0.57793 |
| 일경산업개발 | 0.25365 |
| 와토스코리아 | 0.58708 |
| CJ CGV | 0.75139 |
| 한창산업 | 0.50566 |
| EMW | 0.48176 |
| 제우스 | 0.6833 |
| 리바트 | 0.78723 |
| 서산 | 0.79879 |
| 사조해표 | 0.62337 |
| 디이엔티 | 0.67209 |
| 가비아 | 0.6946 |
| LIG에이디피 | 0.66357 |
| 동양이엔피 | 0.78457 |
| 투비소프트 | 0.62079 |
| 휴비스 | 0.74772 |
| 에스엔유 | 0.67726 |
| 이상네트웍스 | 0.69277 |
| 모두투어 | 0.64441 |
| 아시아1호 | 0.09398 |
| 제주반도체 | 0.39591 |
| 이노칩 | 0.46878 |
| 세진전자 | 0.57451 |
| 성창오토텍 | 0.67805 |
| 오디텍 | 0.64805 |
| 코디에스 | 0.69066 |
| 동북아3호 | 0.1479 |
| 동북아4호 | 0.12268 |
| 일진다이아 | 0.71166 |
| 티플랙스 | 0.62855 |
| 아시아2호 | 0.25966 |
| 아시아3호 | 0.14215 |
| 아시아4호 | 0.07185 |
| 세미텍 | 0.57856 |
| 성우전자 | 0.57406 |
| 휠라코리아 | 0.46687 |
| 아시아8호 | 0.29764 |
| 아시아9호 | 0.09752 |
| 넥스지 | 0.7109 |
| 옵트론텍 | 0.68009 |
| 아시아5호 | 0.09977 |
| 아시아6호 | 0.22769 |
| 아시아7호 | 0.1455 |
| 젬백스 | 0.57761 |
| 피엘에이 | 0.6647 |
| 동양생명 | 0.62008 |
| 크루셜엠스 | 0.52954 |
| 두산엔진 | 0.71872 |
| 루미마이크로 | 0.61808 |
| 우리이티아이 | 0.59642 |
| 비츠로셀 | 0.69817 |
| 실리콘화일 | 0.554 |
| 엘오티베큠 | 0.70742 |
| 동북아10호 | 0.12838 |
| 동북아11호 | 0.32015 |
| 동북아12호 | 0.37437 |
| 동북아13호 | 0.27002 |
| 동북아14호 | 0.24512 |
| KPX그린케미칼 | 0.09027 |
| GST | 0.52635 |
| KJ프리텍 | 0.54132 |
| 케이엠 | 0.7462 |
| 아시아10호 | 0.26492 |
| 아시아11호 | 0.16921 |
| 아시아12호 | 0.16992 |
| 아시아13호 | 0.1806 |
| 아시아14호 | 0.05243 |
| 아시아15호 | 0.065 |
| 윈포넷 | 0.55347 |
| 비에이치아이 | 0.61396 |
| 젠트로 | 0.6701 |
| 크리스탈 | 0.80339 |
| 아바코 | 0.62916 |
| 대한제강 | 0.7483 |
| 휴온스 | 0.75229 |
| 수성 | 0.60278 |
| 유진테크 | 0.616 |
| 동양고속 | 0.36683 |
| 이월드 | 0.80381 |
| 대상홀딩스 | 0.81842 |
| 대상홀딩스우 | 0.57817 |
| 팅크웨어 | 0.70776 |
| 베이직하우스 | 0.53952 |
| 바이로메드 | 0.64807 |
| 엔케이 | 0.61048 |
| 루트로닉 | 0.75858 |
| 차바이오앤 | 0.72669 |
| 뉴프렉스 | 0.6594 |
| 바이오톡스텍 | 0.76199 |
| 진바이오텍 | 0.52969 |
| 씨앤비텍 | 0.55477 |
| 화신테크 | 0.59661 |
| 현대글로비스 | 0.35919 |
| 유니테스트 | 0.76237 |
| 동국제약 | 0.49866 |
| 에코프로 | 0.42775 |
| 비엠티 | 0.5501 |
| 하나금융지주 | 0.30401 |
| 신양 | 0.37347 |
| 이수앱지스 | 0.83208 |
| 메디톡스 | 0.71243 |
| MDS테크 | 0.73638 |
| 미디어플렉스 | 0.71808 |
| 스틸플라워 | 0.75766 |
| 네패스신소재 | 0.66147 |
| 동아엘텍 | 0.66497 |
| 이원컴포텍 | 0.68777 |
| 한화생명 | 0.07972 |
| 이녹스 | 0.64854 |
| 진도 | 0.50096 |
| 에이스테크 | 0.56904 |
| 동우 | 0.53887 |
| 맥쿼리인프라 | 0.16575 |
| 켐트로닉스 | 0.66767 |
| 테크윙 | 0.62347 |
| 넥스턴 | 0.58375 |
| 케이씨티 | 0.73381 |
| 용현BM | 0.25579 |
| 현대EP | 0.74585 |
| 아이테스트 | 0.67451 |
| 나스미디어 | 0.58999 |
| 제이티 | 0.56201 |
| 유비벨록스 | 0.6877 |
| 고려반도체 | 0.57026 |
| 상아프론테크 | 0.56068 |
| 평화산업 | 0.72128 |
| 잘만테크 | 0.7197 |
| 광진윈텍 | 0.57172 |
| 노루페인트 | 0.79839 |
| 노루페인트우 | 0.61689 |
| 로보스타 | 0.73279 |
| 아비스타 | 0.5509 |
| 아모레퍼시픽 | 0.55226 |
| 아모레퍼시픽우 | 0.40127 |
| 비에이치 | 0.71283 |
| AST젯텍 | 0.69734 |
| 코크렙8호 | 0.14588 |
| 동부로봇 | 0.70071 |
| SIMPAC METALLOY | 0.31504 |
| 연이정보통신 | 0.48473 |
| 코리아02호 | 0.50801 |
| 코리아03호 | 0.42862 |
| 코리아04호 | 0.47734 |
| 세원셀론텍 | 0.78669 |
| 이엠텍 | 0.57467 |
| KODEX 반도체 | -0.00961 |
| KODEX 은행 | 0.09233 |
| KODEX 자동차 | 0.12404 |
| KOSEF IT | -0.03523 |
| TIGER KRX100 | 0.116 |
| TIGER 은행 | 0.07421 |
| TIGER 반도체 | 0.03039 |
| S&K폴리텍 | 0.53098 |
| 텔레필드 | 0.643 |
| 상신이디피 | 0.72904 |
| 남화토건 | 0.50908 |
| 디지텍시스템 | 0.66658 |
| 파트론 | 0.63447 |
| 나노캠텍 | 0.57469 |
| 아미코젠 | 0.38511 |
| 디엔에프 | 0.72328 |
| 이크레더블 | 0.59642 |
| 디아이씨 | 0.63195 |
| KEC | 0.69783 |
| KPX홀딩스 | 0.30327 |
| 현우산업 | 0.54632 |
| 기신정기 | 0.64 |
| 한라IMS | 0.824 |
| 넥스트칩 | 0.5762 |
| 바다로3호 | 0.34264 |
| 네오팜 | 0.56477 |
| LG패션 | 0.67442 |
| 빅솔론 | 0.74285 |
| 이필름 | 0.64058 |
| 에리트베이직 | 0.8026 |
| 케이아이엔엑스 | 0.62415 |
| 후성 | 0.77187 |
| 풍강 | 0.73178 |
| 매커스 | 0.76828 |
| 다믈멀티미디어 | 0.77319 |
| 서원인텍 | 0.71113 |
| 이엘케이 | 0.66397 |
| 효성ITX | 0.9106 |
| 갤럭시아컴즈 | 0.72445 |
| 맵스리얼티1 | 0.20052 |
| 일진에너지 | 0.61164 |
| 슈프리마 | 0.61215 |
| 참좋은레져 | 0.6505 |
| 코닉글로리 | 0.38862 |
| 푸른기술 | 0.79167 |
| 제이엠티 | 0.64874 |
| 이엠코리아 | 0.79575 |
| 웨이브일렉트로 | 0.50518 |
| 엔에스브이 | 0.37305 |
| ISC | 0.61613 |
| 미래나노텍 | 0.77105 |
| 테스 | 0.79939 |
| 네오위즈게임즈 | 0.81707 |
| 제넥신 | 0.81858 |
| 웅진씽크빅 | 0.51283 |
| 에스에너지 | 0.67014 |
| 이트론 | 0.54277 |
| 청담러닝 | 0.6463 |
| 베트남개발1 | 0.08954 |
| 대창솔루션 | 0.67636 |
| 씨젠 | 0.6288 |
| 알에프세미 | 0.67756 |
| 에스코넥 | 0.85343 |
| 멜파스 | 0.73461 |
| 세우테크 | 0.67628 |
| JW홀딩스 | 0.70209 |
| SK이노베이션 | 0.62041 |
| SK이노베이션우 | 0.47141 |
| 엘디티 | 0.72699 |
| 한진중공업 | 0.63168 |
| 엠씨넥스 | 0.6264 |
| TIGER 가치주 | -0.02136 |
| TIGER 미드캡 | -0.02105 |
| TREX 중소형가치 | 0.10077 |
| 에스맥 | 0.76456 |
| 윈팩 | 0.684 |
| 효성오앤비 | 0.60159 |
| CJ제일제당 | 0.55171 |
| CJ제일제당 우 | 0.77331 |
| 마이크로컨텍솔 | 0.72301 |
| 고영 | 0.49148 |
| TIGER 미디어통신 | 0.20442 |
| 에스티오 | 0.66463 |
| KODEX China H | 0.20567 |
| 아이센스 | 0.57524 |
| SDN | 0.43664 |
| 쎄트렉아이 | 0.80003 |
| 하나니켈1호 | 0.35317 |
| 하나니켈2호 | 0.23334 |
| 동방선기 | 0.79828 |
| SMEC | 0.79362 |
| ITX시큐리티 | 0.39554 |
| 한솔신텍 | 0.65381 |
| 씨그널정보통신 | 0.29249 |
| 모바일리더 | 0.65932 |
| 삼강엠앤티 | 0.52628 |
| 뷰웍스 | 0.65172 |
| 동국S&C | 0.73668 |
| 비상교육 | 0.63595 |
| 진양홀딩스 | 0.87887 |
| 서암기계공업 | 0.65996 |
| 세운메디칼 | 0.73153 |
| S&TC | 0.14015 |
| KOSEF KRX100 | -0.01006 |
| 디엠씨 | 0.14636 |
| SBS미디어홀딩스 | 0.52371 |
| 아티스 | 0.58891 |
| 월덱스 | 0.4049 |
| 우림기계 | 0.65645 |
| 씨큐브 | 0.43709 |
| KODEX Japan | 0.45305 |
| 모베이스 | 0.69022 |
| 아이엠 | 0.6437 |
| 네오피델리티 | 0.75212 |
| 에스앤에스텍 | 0.66572 |
| 코리아에스이 | 0.53889 |
| 한국정밀기계 | 0.73824 |
| 조이맥스 | 0.54284 |
| 인화정공 | 0.47172 |
| 우양에이치씨 | 0.62683 |
| 파브코 | 0.43428 |
| TIGER 200 | 0.02207 |
| 어보브반도체 | 0.72869 |
| 해덕파워웨이 | 0.40958 |
| 동성홀딩스 | 0.6859 |
| 쌍방울 | 0.82523 |
| 이연제약 | 0.7239 |
| 이엔에프테크놀로지 | 0.68229 |
| KODEX 삼성그룹 | 0.10968 |
| 코오롱생명과학 | 0.78721 |
| KODEX 조선 | 0.13618 |
| KODEX 증권 | 0.20466 |
| 웅진에너지 | 0.74478 |
| 풍산 | 0.62973 |
| 에스앤더블류 | 0.60859 |
| 일진전기 | 0.64203 |
| 대성파인텍 | 0.79484 |
| 신성이엔지 | 0.6794 |
| 신성에프에이 | 0.79034 |
| 네오위즈인터넷 | 0.76623 |
| 동양피엔에프 | 0.64719 |
| 티케이케미칼 | 0.65773 |
| KOSEF 블루칩 | 0.00952 |
| KOSEF 고배당 | -0.00125 |
| 코렌텍 | 0.61591 |
| KODEX Brazil | 0.47738 |
| 한국철강 | 0.23297 |
| 원익머트리얼즈 | 0.3264 |
| TIGER 라틴 | 0.09359 |
| TIGER 브릭스 | -0.00055 |
| KINDEX200 | 0.09537 |
| KINDEX 성장대형F15 | 0.16405 |
| 케이엔더블유 | 0.4889 |
| KB금융 | 0.1947 |
| 한세실업 | 0.57362 |
| 디케이락 | 0.80577 |
| KStar 5대그룹주 | 0.09886 |
| 우진 | 0.49549 |
| 하이소닉 | 0.57752 |
| 하이텍팜 | 0.71023 |
| 파인테크닉스 | 0.34045 |
| 디지탈옵틱 | 0.58141 |
| GIANT 현대차그룹 | 0.07068 |
| 미원에스씨 | 0.47251 |
| 톱텍 | 0.65826 |
| 실리콘웍스 | 0.60622 |
| 대양전기공업 | 0.541 |
| KINDEX 코스닥스타 | 0.00863 |
| KINDEX 삼성그룹SW | -0.05758 |
| KStar 코스닥엘리트30 | 0.00349 |
| TREX 200 | 0.00776 |
| FIRST 스타우량 | 0.01739 |
| LG하우시스 | 0.77349 |
| LG하우시스우 | 0.73404 |
| 디오텍 | 0.54617 |
| KGP | 0.17622 |
| 옵티시스 | 0.55294 |
| 디에스케이 | 0.72537 |
| 진매트릭스 | 0.56562 |
| 동일금속 | 0.53216 |
| 이너스텍 | 0.56706 |
| 모린스 | 0.44907 |
| 쓰리피시스템 | 0.48823 |
| 넥솔론 | 0.41214 |
| 승화프리텍 | 0.54859 |
| 영원무역 | 0.53668 |
| 처음앤씨 | 0.606 |
| 삼본정밀전자 | 0.46865 |
| 위메이드 | 0.49352 |
| 에스에프씨 | 0.348 |
| 디젠스 | 0.8042 |
| GKL | 0.59364 |
| KStar 국고채 | 0.00101 |
| 크루셜텍 | 0.79051 |
| 웰크론강원 | 0.56232 |
| KODEX 국고채 | 0.01477 |
| KPX생명과학 | 0.70933 |
| KINDEX 국고채 | -0.00373 |
| KOSEF 국고채 | 0.11595 |
| 에스이티아이 | 0.49971 |
| 우노앤컴퍼니 | 0.54493 |
| KODEX 인버스 | 0.38802 |
| 아이원스 | 0.45294 |
| 휴맥스 | 0.65387 |
| 인포바인 | 0.58293 |
| 락앤락 | 0.64874 |
| 우리넷 | 0.57387 |
| 디지탈아리아 | 0.53112 |
| 씨유메디칼 | 0.75511 |
| 케이씨에스 | 0.71776 |
| 씨엔플러스 | 0.39491 |
| 스타플렉스 | 0.48052 |
| 이미지스 | 0.53557 |
| KODEX 에너지화학 | 0.09587 |
| 대성에너지 | 0.80855 |
| 알파칩스 | 0.59902 |
| KODEX 철강 | 0.18843 |
| TIGER 차이나 | 0.17382 |
| KODEX 건설 | 0.10913 |
| ARIRANG LG그룹& | 0.13725 |
| 한진해운 | 0.75325 |
| 우리들생명과학 | 0.75771 |
| 골든나래리츠 | 0.85174 |
| 포메탈 | 0.73232 |
| 인터로조 | 0.59911 |
| KC코트렐 | 0.58381 |
| 아이텍반도체 | 0.60863 |
| 지엔씨에너지 | 0.80916 |
| 다나와 | 0.64562 |
| 조선선재 | 0.86857 |
| 코오롱인더 | 0.63313 |
| 코오롱인더우 | 0.57477 |
| 대정화금 | 0.57434 |
| 골프존 | 0.40359 |
| 코크렙15호 | 0.32284 |
| 나노신소재 | 0.53886 |
| 티브이로직 | 0.49996 |
| 코이즈 | 0.71056 |
| 에스디시스템 | 0.48342 |
| ARIRANG KOSPI50 | 0.29316 |
| KOSEF 통안채 | -0.01481 |
| 삼기오토모티브 | 0.42276 |
| TIGER 코스닥프리미어 | 0.10869 |
| KMH | 0.59496 |
| KODEX 레버리지 | 0.6476 |
| 서진오토모티브 | 0.21053 |
| 케이티롤 | 0.45038 |
| 와이지엔터테인먼트 | 0.77802 |
| 아이마켓코리아 | 0.48641 |
| 와이솔 | 0.65395 |
| 엠에스오토텍 | 0.61224 |
| 테라세미콘 | 0.60062 |
| 사파이어테크놀로지 | 0.58899 |
| TIGER 인버스 | 0.29661 |
| TIGER 레버리지 | 0.23778 |
| 제닉 | 0.84659 |
| 코리아에프티 | 0.45442 |
| 하나그린스팩 | 0.8783 |
| 이엠넷 | 0.5176 |
| 한국화장품 | 0.73124 |
| SJM | 0.60506 |
| 알톤스포츠 | 0.44911 |
| KStar 레버리지 | 0.20939 |
| 한일진공 | 0.46775 |
| 아나패스 | 0.68733 |
| 현대에이치씨엔 | 0.71504 |
| 코프라 | 0.74072 |
| 화신정공 | 0.59798 |
| 하이비젼시스템 | 0.61417 |
| 뉴로스 | 0.57746 |
| 제이엔케이히터 | 0.6075 |
| 디엔에이링크 | 0.76394 |
| 피제이메탈 | 0.62901 |
| 대성산업 | 0.19526 |
| 한미약품 | 0.75328 |
| 인터지스 | 0.65458 |
| ARIRANG 네오밸류 | 0.10786 |
| 금호엔티 | 0.82884 |
| 나이스디앤비 | 0.69226 |
| 한전산업 | 0.626 |
| TIGER 원유선물(H) | 0.20957 |
| KOSEF 단기자금 | 0.00514 |
| 티피씨글로벌 | 0.42718 |
| CJ E&M | 0.68071 |
| 하이제1호스팩 | 0.804 |
| 시큐브 | 0.61992 |
| 리켐 | 0.60419 |
| 딜리 | 0.70374 |
| 대한과학 | 0.80314 |
| 티에스이 | 0.58853 |
| 케이비게임앤앱스스팩 | 0.7873 |
| 피앤이솔루션 | 0.68049 |
| 액트 | 0.71962 |
| KINDEX 삼성그룹EW | 0.0151 |
| KODEX 골드선물(H) | 0.59057 |
| TIGER 나스닥100 | 0.02885 |
| 이퓨쳐 | 0.67715 |
| 미원화학 | 0.06559 |
| 화진 | 0.66729 |
| 팀스 | 0.82839 |
| KODEX 소비재 | 0.08156 |
| KStar 우량회사채 | 0.06217 |
| 하림 | 0.81376 |
| 선진 | 0.56529 |
| 쎄미시스코 | 0.45672 |
| 윈스테크넷 | 0.7315 |
| 피엔티 | 0.48615 |
| TIGER 농산물선물(H) | 0.30463 |
| 마이다스 커버드콜 | 0.18741 |
| 넥스트아이 | 0.52882 |
| 제이씨케미칼 | 0.5839 |
| TIGER 그린 | 0.14262 |
| 메리츠금융지주 | 0.22725 |
| 신진에스엠 | 0.58422 |
| KOSEF 달러선물 | 0.30457 |
| 이코리아리츠 | 0.58185 |
| 코오롱플라스틱 | 0.69729 |
| TIGER 삼성그룹 | 0.07616 |
| TIGER LG그룹+ | 0.17633 |
| TIGER 현대차그룹+ | 0.0539 |
| 나이벡 | 0.72109 |
| 엘티에스 | 0.78265 |
| KODEX 구리선물(H) | 0.27254 |
| KODEX 콩선물(H) | 0.38347 |
| BS금융지주 | 0.52294 |
| 경봉 | 0.81705 |
| DGB금융지주 | 0.33938 |
| 하이골드2호 | 0.18382 |
| TIGER 건설기계 | 0.20654 |
| TIGER 조선운송 | 0.07033 |
| TIGER 철강소재 | 0.13271 |
| TIGER 에너지화학 | 0.04809 |
| TIGER IT | 0.09883 |
| TIGER 금융 | 0.15296 |
| TIGER 경기방어 | 0.08888 |
| TIGER 경기민감 | 0.15439 |
| TIGER 금속선물(H) | 0.22277 |
| TIGER 금은선물(H) | 0.27862 |
| 이마트 | 0.16329 |
| KOSEF 달러인버스선물 | 0.06008 |
| 넥스트리밍 | 0.69437 |
| 메지온 | 0.72654 |
| KStar 수출주 | 0.07848 |
| KStar 우량업종 | 0.09018 |
| KODEX 보험 | 0.09246 |
| KODEX 운송 | 0.08066 |
| 트러스제7호 | 0.33853 |
| 광희리츠 | 0.39042 |
| 파워 K100 | 0.10462 |
| 비아트론 | 0.65554 |
| 포티스 | 0.74471 |
| 맥스로텍 | 0.7112 |
| 레고켐바이오 | 0.60874 |
| ARIRANG K100EW | 0.08598 |
| ARIRANG KRX100EW | 0.11735 |
| 아이디스 | 0.17414 |
| 사람인에이치알 | 0.83947 |
| KINDEX 밸류대형 | 0.02626 |
| TIGER S&P500선물(H) | 0.12378 |
| TIGER 헬스케어 | 0.11461 |
| KODEX 은선물(H) | 0.39803 |
| 코오롱머티리얼 | 0.67123 |
| KOSEF 펀더멘탈대형주 | -0.00357 |
| 케이탑리츠 | 0.26942 |
| KINDEX 인버스 | 0.22646 |
| TREX 펀더멘탈 200 | 0.05295 |
| 삼양사 | 0.57912 |
| 삼양사우 | 0.7635 |
| 제룡산업 | 0.78491 |
| TIGER 모멘텀 | 0.12814 |
| KStar 200 | 0.02972 |
| KOSEF 10년국고채 | 0.05032 |
| 케이비부국위탁리츠 | 0.41034 |
| 모다정보통신 | 0.57134 |
| 아바텍 | 0.75668 |
| TIGER 중국소비테마 | 0.10074 |
| 파수닷컴 | 0.7304 |
| KG ETS | 0.76844 |
| 나노스 | 0.46706 |
| ARIRANG 200 | 0.09772 |
| TIGER 생활소비재 | 0.09478 |
| KOSEF 200 선물 | 0.03461 |
| KINDEX 레버리지 | 0.27882 |
| 한국ANKOR유전 | 0.17168 |
| 파워 K200 | 0.02414 |
| KODEX 단기채권 | 0.06859 |
| iKon 100 | 0.13798 |
| 하이골드3호 | 0.20979 |
| 네이블 | 0.64876 |
| 우리이앤엘 | 0.74949 |
| 와이엠씨 | 0.68163 |
| DSR | 0.69286 |
| 바다로19호 | 0.14998 |
| 지디 | 0.56647 |
| KODEX MSCI KOREA | 0.00085 |
| TIGER 유동자금 | -0.00362 |
| TIGER 소프트웨어 | 0.00584 |
| TIGER 증권 | 0.09365 |
| TIGER 자동차 | 0.29232 |
| TIGER 화학 | 0.23582 |
| 세호로보트 | 0.65688 |
| 삼목강업 | 0.71369 |
| 제로투세븐 | 0.55121 |
| CS엘쏠라 | 0.6015 |
| TIGER 구리실물 | 0.01382 |
| 애경유화 | 0.64002 |
| 한국타이어 | 0.51659 |
| ARIRANG 방어주 | 0.03523 |
| ARIRANG 주도주 | 0.04866 |
| ARIRANG 배당주 | 0.03442 |
| ARIRANG 자동차 | 0.09681 |
| ARIRANG 조선운송 | -0.04763 |
| ARIRANG 철강금속 | 0.0169 |
| ARIRANG 화학 | 0.12889 |
| 한국콜마 | 0.80919 |
| 동일고무벨트 | 0.81108 |
| KODEX 주식&골드(H) | 0.22464 |
| TIGER 커버드C200 | 0.06371 |
| KOSEF 10년국고채 레 | 0.1066 |
| 한국패러랠 | 0.48287 |
| KINDEX 중국본토CSI30 | 0.24321 |
| KODEX CHINA A50 | 0.36798 |
| TIGER 베타플러스 | 0.25378 |
| 파이오링크 | 0.82029 |
| 동아에스티 | 0.75545 |
| 엘티씨 | 0.83046 |
| TIGER 로우볼 | 0.03255 |
| KStar 중국본토 CSI10 | 0.10868 |
| JB금융지주 | 0.44631 |
| KODEX 인버스국채선물 | 0.28726 |
| 한진칼 | 0.69938 |
| 한진칼우 | 0.85827 |
| KINDEX 합성-선진국하 | 0.08702 |
| KINDEX 합성-미국리츠 | 0.03679 |
| NHN엔터테인먼트 | 0.23097 |
| TIGER합성-MSCI US리 | 0.02717 |
| KStar 채권혼합 | 0.27806 |
| KStar 주식혼합 | 0.35648 |
| 차이나그레이트 | 0.87661 |
| 중국원양자원 | 0.56487 |
| 글로벌에스엠 | 0.69459 |
| 에스앤씨엔진그룹 | 0.44063 |
| 차이나하오란 | 0.59433 |
| 뉴프라이드 | 0.46282 |
| 이스트아시아홀딩스 | 0.40112 |
| 차이나킹 | 0.70026 |
| 웨이포트 | 0.72821 |
| 코라오홀딩스 | 0.63996 |
| 완리 | 0.61541 |
| 화풍집단 KDR | 0.37074 |
| SBI모기지 | 0.49608 |
| SBI액시즈 | 0.66236 |
| 엑세스바이오(Reg.S) | 0.6053 |
| 루멘스 | 0.73675 |
| 네오티스 | 0.56733 |
Information is provided "as is" and solely for informational purposes, not for trading purposes or advice, and may be delayed.
Information provided by the investment decisions are not legally responsible for. In addition, the information posted can not be distributed without permission.
'Analysis' 카테고리의 다른 글
| The greatest number : B type (0) | 2014.06.04 |
|---|---|
| Zero Group Correlation Distribution (0) | 2014.06.01 |
| KOSPI, KOSDAQ 2,000 Stocks Sharpe Ratio Distribution (0) | 2014.05.28 |
| Global Markets Moving Average Analysis (0) | 2014.03.29 |
| 2013 Oct, 2013 Dec All Correlation Distribution (0) | 2014.03.15 |
댓글