
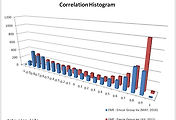
X axis : Stocks Price Correlation Coefficient |
Y axis : Quantity of stocks |
May-2016 |
1,000 Day Parameter |
4,338 NYSE Stocks Price |
Analysis |
This stock mode of correlation coefficient is -0.7 |
In other words, the correlation coefficient of the other stocks is the many levels -0.7 |
Kurtosis of the distribution of the correlation is -1.43, and skew is -0.2 |
Zero Correlation Histogram |
- The stock pair is concentrated in the correlation coefficient zero. |
- Case the diversification, Zero type will Overweight of the portfolio. |
- And, Zero type are often low volatility. |
Type A Correlation Histogram |
- The stock pair is concentrated in the plus high correlation coefficient and minus high correlation coefficient. |
- The A type will underweight of the portfolio. |
- This is not a normal distribution. |
Type B Correlation Histogram |
- The stock pair is concentrated in the plus high correlation coefficient. |
- The B type will underweight of the portfolio. |
- This is not a normal distribution. |
Type C Correlation Histogram |
- The stock pair is concentrated in the minus high correlation coefficient. |
- The C type will underweight of the portfolio. |
- This is not a normal distribution. |
Information is provided "as is" and solely for informational purposes, not for trading purposes or advice, and may be delayed. |
Information provided by the investment decisions are not legally responsible for. In addition, the information posted can not be distributed without permission. |
'NYSE' 카테고리의 다른 글
| Emcor Group Inc NYSE $EME Correlation Histogram (0) | 2016.09.19 |
|---|---|
| Templeton Emerging Markets NYSE $EMF Correlation Histogram (0) | 2016.09.19 |
| S_P Emerging Markets Infrastru NYSE $EMIF Correlation Histogram (0) | 2016.09.19 |
| SPDR Dow Jones Wilshire Mid Ca NYSE $EMM Correlation Histogram (0) | 2016.09.19 |
| MSCI Emerging Markets Material NYSE $EMMT Correlation Histogram (0) | 2016.09.19 |


댓글