
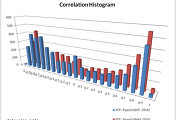
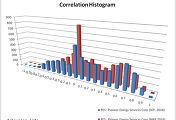
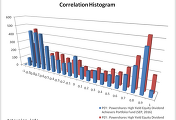
X axis : Stocks Price Correlation Coefficient |
Y axis : Quantity of stocks |
Sep-2016 |
1,000 Day Parameter |
4,338 NYSE Stocks Price |
Analysis |
This stock mode of correlation coefficient is 0.8 |
In other words, the correlation coefficient of the other stocks is the many levels 0.8 |
Kurtosis of the distribution of the correlation is -1.23, and skew is -0.42 |
Zero Correlation Histogram |
- The stock pair is concentrated in the correlation coefficient zero. |
- Case the diversification, Zero type will Overweight of the portfolio. |
- And, Zero type are often low volatility. |
Type A Correlation Histogram |
- The stock pair is concentrated in the plus high correlation coefficient and minus high correlation coefficient. |
- The A type will underweight of the portfolio. |
- This is not a normal distribution. |
Type B Correlation Histogram |
- The stock pair is concentrated in the plus high correlation coefficient. |
- The B type will underweight of the portfolio. |
- This is not a normal distribution. |
Type C Correlation Histogram |
- The stock pair is concentrated in the minus high correlation coefficient. |
- The C type will underweight of the portfolio. |
- This is not a normal distribution. |
Information is provided "as is" and solely for informational purposes, not for trading purposes or advice, and may be delayed. |
Information provided by the investment decisions are not legally responsible for. In addition, the information posted can not be distributed without permission. |
'NYSE' 카테고리의 다른 글
| Petroleum _amp_ Resources Corp NYSE $PEO Correlation Histogram (0) | 2016.12.09 |
|---|---|
| PepsiCo NYSE $PEP Correlation Histogram (0) | 2016.12.09 |
| Pioneer Energy Services Corp NYSE $PES Correlation Histogram (0) | 2016.12.09 |
| Powershares High Yield Equity NYSE $PEY Correlation Histogram (0) | 2016.12.09 |
| Powershares Dynamic Consumer D NYSE $PEZ Correlation Histogram (0) | 2016.12.09 |

댓글