
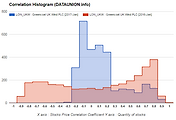
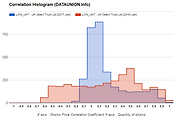
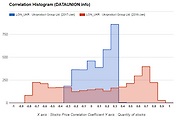
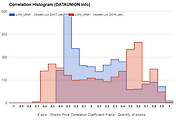
X axis : Stocks Price Correlation Coefficient
Y axis : Quantity of stocks
1,000 Day Parameter
3,214 LONDON Stocks Price
1. Zero Correlation Histogram |
- The stock pair is concentrated in the correlation coefficient zero. |
- Case the diversification, Zero type will Overweight of the portfolio. |
- And, Zero type are often low volatility. |
2. Type A Correlation Histogram |
- The stock pair is concentrated in the plus high correlation coefficient and minus high correlation coefficient. |
- The A type will underweight of the portfolio. |
- This is not a normal distribution. |
3. Type B Correlation Histogram |
- The stock pair is concentrated in the plus high correlation coefficient. |
- The B type will underweight of the portfolio. |
- This is not a normal distribution. |
4. Type C Correlation Histogram |
- The stock pair is concentrated in the minus high correlation coefficient. |
- The C type will underweight of the portfolio. |
- This is not a normal distribution. |
Information is provided "as is" and solely for informational purposes, not for trading purposes or advice, and may be delayed.
Information provided by the investment decisions are not legally responsible for. In addition, the information posted can not be distributed without permission.
'LONDON' 카테고리의 다른 글
| Greencoat UK Wind PLC NYSE $LON_UKW Correlation Histogram (0) | 2017.03.12 |
|---|---|
| UK Select Trust Ltd NYSE $LON_UKT Correlation Histogram (0) | 2017.03.12 |
| Ukrproduct Group Ltd. NYSE $LON_UKR Correlation Histogram (0) | 2017.03.12 |
| Ossiam Lux NYSE $LON_UKMV Correlation Histogram (0) | 2017.03.12 |
| UK Mail Group PLC NYSE $LON_UKM Correlation Histogram (0) | 2017.03.12 |
댓글