
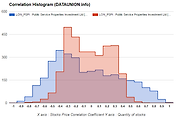
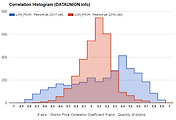
X axis : Stocks Price Correlation Coefficient
Y axis : Quantity of stocks
1,000 Day Parameter
3,214 LONDON Stocks Price
1. Zero Correlation Histogram |
- The stock pair is concentrated in the correlation coefficient zero. |
- Case the diversification, Zero type will Overweight of the portfolio. |
- And, Zero type are often low volatility. |
2. Type A Correlation Histogram |
- The stock pair is concentrated in the plus high correlation coefficient and minus high correlation coefficient. |
- The A type will underweight of the portfolio. |
- This is not a normal distribution. |
3. Type B Correlation Histogram |
- The stock pair is concentrated in the plus high correlation coefficient. |
- The B type will underweight of the portfolio. |
- This is not a normal distribution. |
4. Type C Correlation Histogram |
- The stock pair is concentrated in the minus high correlation coefficient. |
- The C type will underweight of the portfolio. |
- This is not a normal distribution. |
Information is provided "as is" and solely for informational purposes, not for trading purposes or advice, and may be delayed.
Information provided by the investment decisions are not legally responsible for. In addition, the information posted can not be distributed without permission.
'LONDON' 카테고리의 다른 글
| Public Service Properties Inve LONDON $LON_PSPI Correlation Histogram (0) | 2017.03.05 |
|---|---|
| Pearson plc LONDON $LON_PSON Correlation Histogram (0) | 2017.03.05 |
| Photonstar Led Group PLC LONDON $LON_PSL Correlation Histogram (0) | 2017.03.05 |
| Pow Palisades Gl Wa LONDON $LON_PSHO Correlation Histogram (0) | 2017.03.05 |
| Powershares Global Ireland Agr LONDON $LON_PSGA Correlation Histogram (0) | 2017.03.05 |


댓글