
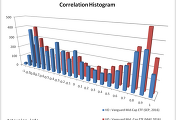
X axis : Stocks Price Correlation Coefficient |
Y axis : Quantity of stocks |
Sep-2016 |
1,000 Day Parameter |
4,338 NYSE Stocks Price |
Analysis |
This stock mode of correlation coefficient is 0.9 |
In other words, the correlation coefficient of the other stocks is the many levels 0.9 |
Kurtosis of the distribution of the correlation is -1.12, and skew is -0.43 |
Zero Correlation Histogram |
- The stock pair is concentrated in the correlation coefficient zero. |
- Case the diversification, Zero type will Overweight of the portfolio. |
- And, Zero type are often low volatility. |
Type A Correlation Histogram |
- The stock pair is concentrated in the plus high correlation coefficient and minus high correlation coefficient. |
- The A type will underweight of the portfolio. |
- This is not a normal distribution. |
Type B Correlation Histogram |
- The stock pair is concentrated in the plus high correlation coefficient. |
- The B type will underweight of the portfolio. |
- This is not a normal distribution. |
Type C Correlation Histogram |
- The stock pair is concentrated in the minus high correlation coefficient. |
- The C type will underweight of the portfolio. |
- This is not a normal distribution. |
Information is provided "as is" and solely for informational purposes, not for trading purposes or advice, and may be delayed. |
Information provided by the investment decisions are not legally responsible for. In addition, the information posted can not be distributed without permission. |
'NYSE' 카테고리의 다른 글
| Vornado Realty L_P_ 7_875_ Pub NYSE $VNOD Correlation Histogram (0) | 2016.11.26 |
|---|---|
| Vanguard REIT ETF NYSE $VNQ Correlation Histogram (0) | 2016.11.26 |
| Vantiv Inc NYSE $VNTV Correlation Histogram (0) | 2016.11.26 |
| Vanguard Mid_Cap ETF NYSE $VO Correlation Histogram (0) | 2016.11.26 |
| VOC Energy Trust NYSE $VOC Correlation Histogram (0) | 2016.11.26 |


댓글