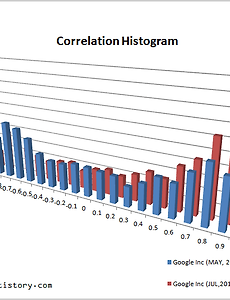
반응형 correlation54 [python] 2021 NASDAQ CORRELATION HISTOGRAM Start Date : 2016/11/30 End Date : 2021/01/07 6,212 NASDAQ, NYSE Stocks Close Price In [1]: import pandas as pd import numpy as np import matplotlib.pyplot as plt import seaborn as sns In [2]: data=pd.read_csv('allstock_t.csv') In [3]: data.head() Out[3]: A AA AACG AACQ AACQU AAIC AAL AAMC AAME AAN ... ZTO ZTR ZTS ZUMZ ZUO ZVO ZYME ZYNE ZYXI TSLA 0 126.16 25.23 1.27 10.54 11.15 3.93 15.38 22.39 .. 2021. 1. 9. Semtech Corporation NASDAQ : SMTC Correlation Histogram X axis : Stocks Price Correlation CoefficientY axis : Quantity of stocksMay-20161,000 Day Parameter2,830 NASDAQ Stocks Price AnalysisThis stock mode of correlation coefficient is 0.6In other words, the correlation coefficient of the other stocks is the many levels 0.6Kurtosis of the distribution of the correlation is -1.23, and skew is -0.09 Correlation Histogram Type Description Zero Correlatio.. 2016. 6. 19. [2016-MAY] Google Inc NASDAQ : GOOG Correlation Histogram X axis : Stocks Price Correlation CoefficientY axis : Number of stocksMAY-20161,000 Day Parameter2,830 NASDAQ Stocks Price AnalysisThis stock mode of correlation coefficient is -0.7.In other words, the correlation coefficient of the other stocks is the many levels -0.7.Kurtosis of the distribution of the correlation is -1.45, and skew is 0.07.The stock are to be concentrated in the correlation c.. 2016. 5. 27. Depomed Inc (NASDAQ : DEPO) Stock Correlation Histogram Correlation Histogram || DATAUNION Create column charts AnalysisThis stock mode of correlation coefficient is 0.8.In other words, the correlation coefficient of the other stocks is the many levels 0.8.Kurtosis of the distribution of the correlation is -1.41, and skew is -0.16.The stock are to be concentrated in the correlation coefficient 0.8 and The high correlation holds many stocks.A correlat.. 2016. 4. 11. 이전 1 2 3 4 ··· 14 다음 반응형