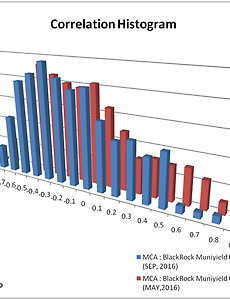
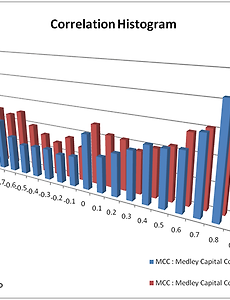
반응형 NYSE7831 BlackRock Muniyield California NYSE $MCA Correlation Histogram X axis : Stocks Price Correlation CoefficientY axis : Quantity of stocksSep-20161,000 Day Parameter4,338 NYSE Stocks Price AnalysisThis stock mode of correlation coefficient is -0.3In other words, the correlation coefficient of the other stocks is the many levels -0.3Kurtosis of the distribution of the correlation is 0.05, and skew is 0.66 Correlation Histogram Type Description Zero Correlation .. 2016. 12. 19. Medley Capital Corp NYSE $MCC Correlation Histogram X axis : Stocks Price Correlation CoefficientY axis : Quantity of stocksSep-20161,000 Day Parameter4,338 NYSE Stocks Price AnalysisThis stock mode of correlation coefficient is 0.9In other words, the correlation coefficient of the other stocks is the many levels 0.9Kurtosis of the distribution of the correlation is -1.2, and skew is -0.4 Correlation Histogram Type Description Zero Correlation Hi.. 2016. 12. 19. McDonald's Corporation NYSE $MCD Correlation Histogram X axis : Stocks Price Correlation CoefficientY axis : Quantity of stocksSep-20161,000 Day Parameter4,338 NYSE Stocks Price AnalysisThis stock mode of correlation coefficient is -0.3In other words, the correlation coefficient of the other stocks is the many levels -0.3Kurtosis of the distribution of the correlation is -0.9, and skew is 0.51 Correlation Histogram Type Description Zero Correlation .. 2016. 12. 19. Babson Capital Corporate Inves NYSE $MCI Correlation Histogram MCI X axis : Stocks Price Correlation CoefficientY axis : Quantity of stocksSep-20161,000 Day Parameter4,338 NYSE Stocks Price AnalysisThis stock mode of correlation coefficient is 0In other words, the correlation coefficient of the other stocks is the many levels 0Kurtosis of the distribution of the correlation is 34.96, and skew is 6.08 Correlation Histogram Type Description Zero Correlation H.. 2016. 12. 19. 이전 1 ··· 259 260 261 262 263 264 265 ··· 1958 다음 반응형